Download
1 / 29
300 likes | 306 Views
Patterns and Linear Functions. Goals. Goal. Rubric. Level 1 – Know the goals. Level 2 – Fully understand the goals. Level 3 – Use the goals to solve simple problems. Level 4 – Use the goals to solve more advanced problems .

E N D
Goals Goal Rubric Level 1 – Know the goals. Level 2 – Fully understand the goals. Level 3 – Use the goals to solve simple problems. Level 4 – Use the goals to solve more advanced problems. Level 5 – Adapts and applies the goals to different and more complex problems. • To identify and represent patterns that describe linear functions.
Vocabulary • Dependent Variable • Independent Variable • Input • Output • Function • Linear Function
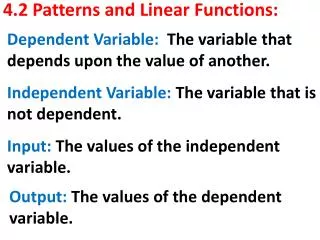
Definition • Dependent Variable – A variable whose value depends on some other value. • Generally, y is used for the dependent variable. • Independent Variable – A variable that doesn’t depend on any other value. • Generally, x is used for the independent variable. • The value of the dependent variabledepends on the value of the independent variable.
On a graph; the independent variable is on the horizontal or x-axis. the dependent variable is on the vertical or y-axis. Independent and Dependent Variables y dependent x independent
Example: Identify the independent and dependent variables in the situation. A painter must measure a room before deciding how much paint to buy. The amount of paintdependson the measurement of a room. Dependent: amount of paint Independent: measurement of the room
Example: Identify the independent and dependent variables in the situation. The height of a candle decrease d centimeters for every hour it burns. The height of a candledepends on the number of hours it burns. Dependent: height of candle Independent: time
Example: Identify the independent and dependent variables in the situation. A veterinarian must weight an animal before determining the amount of medication. The amount of medicationdepends on the weight of an animal. Dependent: amount of medication Independent: weight of animal
Your Turn: Identify the independent and dependent variable in the situation. A company charges $10 per hour to rent a jackhammer. The cost to rent a jackhammerdependson the length of time it is rented. Dependent variable: cost Independent variable: time
Your Turn: Identify the independent and dependent variable in the situation. Camryn buys p pounds of apples at $0.99 per pound. The cost of applesdepends on the number of pounds bought. Dependent variable: cost Independent variable: pounds
Example: Representing a Geometric Relationship In the diagram below, what is the relationship between the number of rectangles and the perimeter of the figure they form? Represent this relationship using a table, words, an equation, and a graph.
Example: Representing a Geometric Relationship Step 1 Make a table. Use the number of rectangles as the independent variable (x) and the perimeter as the dependent variable (y). Perimeter = 2(length) + 2(width)
Example: Representing a Geometric Relationship Step 2 Look for a pattern in the table. How did you calculate the perimeter (y), given the number of rectangles (x)? Then describe the pattern in words. Perimeter = 2(length) + 2(width) Words: Multiply the number of rectangles in each figure by 2 to get the total length of the top and bottom sides of the combined figure. Then add 2(6), or 12, for the total length of the left and right sides of the combined figure to get the entire perimeter.
Example: Representing a Geometric Relationship Step 3 From the pattern in the table write an equation to represent the relationship between x and y. Equation: y = 2x + 12 Constant x y
Example: Representing a Geometric Relationship Step 4 Use the table to make a graph. With a graph, you can see a pattern formed by the relationship between the number of rectangles and the perimeter of the figure.
Your Turn: In the diagram below, what is the relationship between the number of triangles and the perimeter of the figure they form? Represent the relationship using (1) a table, (2) words, (3) an equation, and (4) a graph.
Answer: • Multiply the number of triangles by 4 and add 6. • y = 4x + 6
Definition • Input – Values of the independent variable. • x – values • The input is the value substituted into an equation. • Output – Values of the dependent variable. • y – values. • The output is the result of that substitution in an equation.
Function • In the last 2 problems you can describe the relationship by saying that the perimeter (dependent variable – y value) is a function of the number of figures (independent variable – x value). • A function is a relationship that pairs each input value with exactly one output value.
Function input You can think of a function as an input-output machine. x 6 2 function y = 5x 5x 10 30 output
Helpful Hint There are several different ways to describe the variables of a function. Independent Variable Dependent Variable y-values x-values Input Output Domain Range x f(x)
A function is a set of ordered pairs (x, y) so that each x-value corresponds to exactly one y-value. Some functions can be described by a rule written in words, such as “double a number and then add nine to the result,” or by an equation with two variables. One variable (x) represents the input, and the other variable (y) represents the output. Function Rule y = 2x + 9 Output variable Input variable
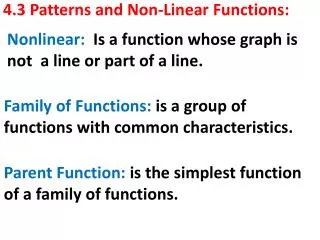
Linear Function • Another method of representing a function is with a graph. • A linear function is a function whose graph is a nonvertical line or part of a nonvertical line.
Example: Representing a Linear Function A DVD buyers club charges a $20 membership fee and $15 per DVD purchased. The table below represents this situation. +15 +15 +15 +15 +15 Find the first differences for the total cost. constant linear Since the data shows a ___________ difference the pattern is __________. If a pattern is linear then its graph is a straight _________. line
The equation represents this situation. This is called a linear equation. 80 70 Constant difference or price per DVD Membership fee (x = 0) 60 50 40 30 20 10 1 2 3 4 5
Your Turn: The costs associated with being a member of a CD Club are presented in the table below. Find the first differences and write an equation to represent the data pattern. +13 +13 +13 +13 +13 $13 The club charges _________ per CD. The cost for 0 CDs is ____________. Therefore, the club membership (initial cost) must be _________. $26 $26
Your Turn: The table shows the costs associated with being a member of a DVD club that charges a membership fee. Write an equation to represent the pattern in the data. +10
Your Turn: The table shows the amount of water y in a tank after x minutes of being drained. • Is the relationship function? • Describe the relationship using words. • Write an equation for the relationship. 1. The relationship is a function. The amount of water in gallons left in the tank is 440 minus 12 times the number of minutes. 3. y = 440 – 12x
Joke Time • Why did the pilgrims' pants always fall down? • Because their belts were on their hats. • What kind of birds flock together? • Vel-crows. • What is the difference between a freshman and a cell phone. • You can put a cell phone on silent.