Download
1 / 21
210 likes | 211 Views
This project aims to detect cosmic rays using statistical analysis of simultaneous clicks recorded by two Geiger counters. The data will be analyzed to determine if the clicks are due to cosmic ray showers or random coincidence.

E N D
An attempt to detect Cosmic Rays coming into our atmosphere with the help of some statistics By Rodney Howe, MS. GIS/Remote Sensing 07.02.2002
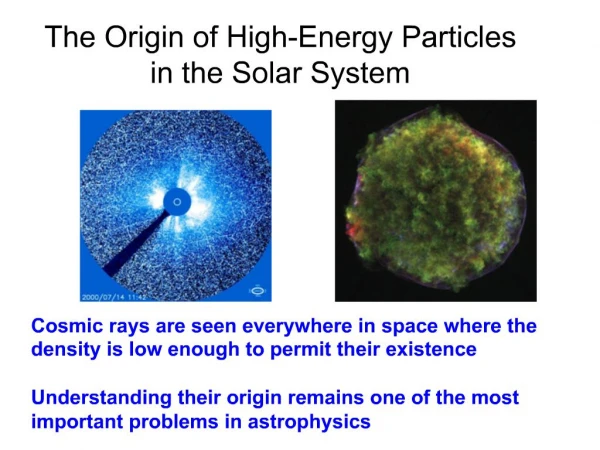
Menzel 3 in the constellation Norma might be a source for Cosmic Rays in our galaxy High energy protons produced in these outbursts get trapped in the galactic magnetic field and might make there way into our atmosphere
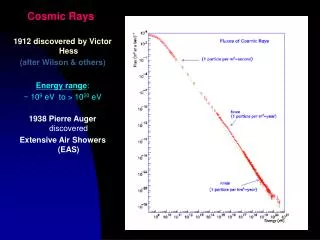
Cosmic Rays greater than the Greisen-Zatsepin-Kuzmin (GZK) limit, eV > 5x 10¹⁷, may come from other galaxies.
Protons that collide with the atmospheric molecules at very high energies, around the GZK limit, electron volts > e19 Cosmic Ray pions, muons Create a shower or cascade of pions that decay into muons (high energy electrons) which might be detected by two separate Geiger counters.
Pierre Auger’s Experiment (1938) with Geiger Counters on the ground • explore the following null hypothesis. • That simultaneous clicks, with two or more detectors spaced a good distance apart (5 - 10 meters), are not coincidental random clicks, but are actual Cosmic Ray Showers from high energy, around the GZK limit, protons impinging on our atmosphere. • explore the alternative hypothesis. • That data do not support that cosmic ray detection is more likely than coincident clicks due to chance, i.e. there might be a chance that coincidental (simultaneous) clicks do not come from cosmic rays created in a cascade shower high in our atmosphere.
Two Geiger counters and a laptop to record coincident clicks. Recording software used: NASA’s Radio Jove, January 2000.
Geiger Counter A: instructions come from John Iovine's 'Electronic Projects for the 21st Century'. The Geiger-Muller tubes on both counters are the same, but the electronics of the detectors is slightly different.
Geiger Counter B: instructions from Images Company at http://www.imagesco.com Counter B, has less voltage output at the earphones than Counter A
Radio Jove software records data from the laptop’s sound card. Counter A and B record at different decibels on the Y axis. Counter A averages around 3, counter B around 2 decibels. Coincident clicks are additive and go as high as 4 decibels.
We can use spread sheet functions to display daily acquired data: Joseph DiVerdi
Then, create histograms of average daily coincident hits. (Joseph DiVerdi) There is some variation from hour to hour, day to day, but is this different than just the random background coincidence?
And finally, total aggregate coincident hits per hour. (Joseph DiVerdi) This gives a nice Poisson distribution, it is a distribution of hourly hits. But can we determine if these are cosmic ray shower events?
The data may tell us more if we could identify clusters, that are different from a set of randomized clusters. For example: we might identify the cluster sizes of counter A counter B, and the additive coincident hits of A + B.
We basically have a "trimodal" distribution in this data. And we are going to want to calculate three thresholds. • The first will be a height that will separate events from counter A compared to counter B. • The second will be a height that will distinguish events from counter B compared to counter A+B. (potential cosmic ray shower) • The third threshold will be to separate out samples with no spike and counter A. One way to identify these three ‘clusters’ is to ‘percolate’ data from the recorded data and let the clusters fall into one of three categories, then compare this with a randomly generated set of clusters.
Some Random Clustering Statistics: AVE ADEV SDEV VAR SKEW CURT 4.97 2.49 2.88 8.28 .00 -1.19 ns: 2744 1639 1021 601 373 226 148 73 48 25 10 3 0 0 0 0 0 0 .47000 500 17665 2512 213.2387 .4810 8.5173930000 .10 .4820 8.5812940000 .10 ns: 2387 1443 839 504 291 178 95 45 40 23 10 7 2 0 0 0 0 0 .48200 500 16933 5331 490.4283 .4910 8.8366640000 .10 .4920 8.1906320000 .10 .4930 9.2464790000 .10 .4940 8.1969880000 .10 Software from a book by Stauffer and Amnon, 1992, 'Introduction to Percolation Theory'. *note the skew is 0, indicating clusters are random. * note the skew is 0, which indicates the clusters are random.
Plotting the output from the percolation routine using random values from the computer. Log of random cluster sizes on the Y axis, Percolation value p on the X axis.
Read from rajove.log rows= 32800 Please wait... Load R array from temp.log rows= 32433 Some Geiger Counter Clustering Statistics: AVE ADEV SDEV VAR SKEW CURT 2.50 1.11 2.02 4.09 2.36 6.51 .3810 8.7795570000 .10 .3820 8.2940490000 .10 ns: 0 0 0 0 0 0 0 0 33 22 27 11 1 0 0 0 0 0 .38200 500 94 6500 804.0000 .3910 8.2940490000 .10 .3920 8.7795570000 .10 .3930 8.2940490000 .10 ns: 0 0 0 0 0 0 0 0 31 23 27 11 1 0 0 0 0 0 .39300 500 93 6500 841.0000 * note the skew is 2.36, and the Kurtosis is 6.51 which indicates the clusters are not random.
Plotting the output from the percolation routine we can identify three clusters, plus perhaps a fourth. The third cluster will be coincident background noise, but it is difficult to say which of these events are cosmic ray showers.
If we ‘map’ the data in 2D [E] space using a Blue – Red –Yellow pallet we can compare random data to recorded cluster data. This is random background data.
This is clustered from an hour of Radio Jove data. It does not seem possible to determine cosmic ray events with this equipment. Perhaps more sensitive equipment, and longer exposure times?