Download
1 / 10
100 likes | 219 Views
MS&E 220 – Reducing Red-light Accidents: Project Report. Francis Chung Tim Fleming Kazutora Hayashida Ning Wang. Initial Motivations. o Traffic Accidents concern all of us, who drive, and it is one of the biggest causes of death in the US.

E N D
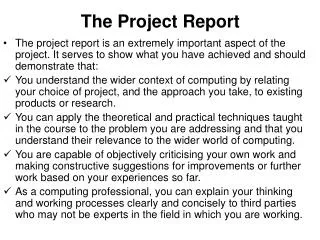
MS&E 220 – Reducing Red-light Accidents: Project Report Francis Chung Tim Fleming Kazutora Hayashida Ning Wang
Initial Motivations • oTraffic Accidents concern all of us, who drive, and it is one of the biggest causes of death in the US. • oMany accidents occur because of the running of traffic lights at road intersections. oWhile it is impractical to incorporate all traffic accidents into a single probability model, the team chose to focus on red light accidents.
Limitations of our Model • Lack of extensive data • oLack of available data in unified formats. • oData from various sources tended to focus on specific factors, such as only weather conditions or different types of traffic accidents. oTo minimize the error, we found data in different categories of intersections, such as intersections with low, medium and high traffic densities • ·
Limitations of our Model • Many hidden input factors specific to each intersection • oThese hidden input factors may be unique to each intersection such that probability models developed for a wide range of intersections cannot fully account for random factors. As a result, a generalized model may have discrepancies between predicted values and actual data collected.
Interesting Applications • Red light cameras • oThe selection of specific red light cameras could be done using the probability model, after it has been more fully developed to incorporate more input variables. • oFrom traffic data collected from candidate intersections, local authorities can calculate the probability of red light accidents. • §With red light cameras installed at high probability areas: • · There is greater deterrence for drivers to run red lights, resulting in fewer accidents. • · There will be greater municipal revenue collected from traffic fines. The revenue collected is a sizeable amount. (data needed to substantiate this point) • ·
Interesting Applications • Cost-benefit analysis of red light cameras • oOur probability model can be expanded to incorporate the presence of red light cameras at an intersection as an input variable. • oBy comparing the probability of red light accidents at intersections with and without red light cameras, we can find the decrease in probability of traffic accidents and relative increase in traffic safety with the use of red light cameras. • oResearch on the cost of installing, maintaining and monitoring red light cameras and the revenue collected from traffic fines. • oConduct cost-benefit analysis of red light cameras by cross-referencing the relative change in traffic safety and the net profit of using red light cameras. • ·
Interesting Applications • Improving road intersection designs • oIf we can expand the number of input variables to the probability model to incorporate more specific factors to each intersection, we can arbitrarily vary some of the input variables, such as the number of lanes of roads leading up to an intersection, speed limits and so on, and observe how accident probability changes. • oSuch analysis can be used in intersection designs to help refine intersection features to reduce red light accidents.
Conclusions • The biggest finding from our analysis was that the rate at which the number of red-light accidents increases with respect to traffic density is faster with the dry weather condition than with wet weather condition. • 1. When the weather condition is wet, drivers become more cautious and therefore the rate at which number of accidents increases does not go up dramatically with the increase in traffic density. For instance, people tend to have more space in-between cars when weather is wet, hence, the effect of traffic density on the number of accidents is smaller compared to the dry weather condition. • 2. Contrary to common perceptions, it might be the fact that people are more careful at driving when raining and on the other hand, when the weather is dry, people tend to pay less attention to traffic rules due to various external factors’ (e.g. temperature, color of the sky) effects on drivers’ psychologies. Therefore, to reduce red-light accidents, regulators should emphasize factors other than simply weather or traffic density. It is important for them to explore other possible reasons that are causing red-light traffic accidents.