Download
1 / 40
400 likes | 498 Views
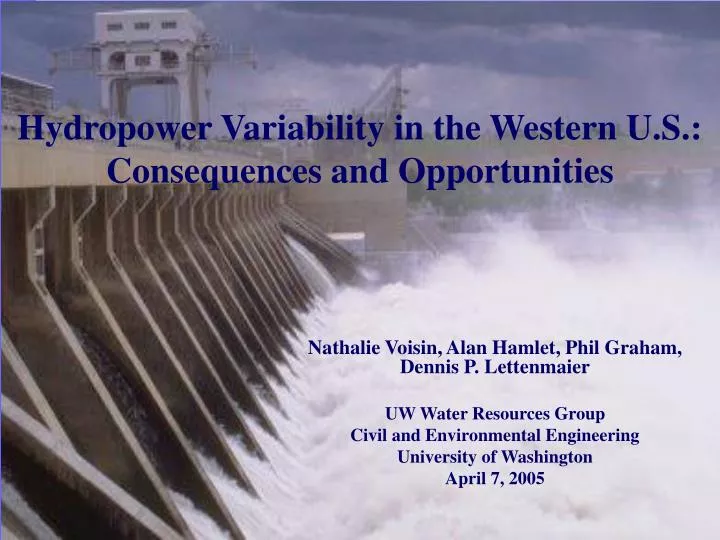
Hydropower Variability in the Western U.S.: Consequences and Opportunities. Nathalie Voisin, Alan Hamlet, Phil Graham, Dennis P. Lettenmaier UW Water Resources Group Civil and Environmental Engineering University of Washington April 7, 2005. Background. Climate is predictable:

E N D
Hydropower Variability in the Western U.S.: Consequences and Opportunities Nathalie Voisin, Alan Hamlet, Phil Graham, Dennis P. Lettenmaier UW Water Resources Group Civil and Environmental Engineering University of Washington April 7, 2005
Background • Climate is predictable: • Increasingly predictable up to 6 months (or more) in advance • West coast U.S. climate more predictable than other regions, due to strong ocean influence • California and the Pacific Northwest are out of phase for some climate events such as El Nino Southern Oscillation (ENSO) • Energy Demand is predictable: • California has regular peaks in winter and summer while energy consumption in the Pacific Northwest (PNW) has a strong winter peak • Question: How can climate predictions be used to manage West Coast energy transfers more efficiently?
In previous episodes … Episodes I to III: Litterature review i) Precipitation, temperature and streamflow predictability based on climate (ENSO and PDO): extensive list ii) Hydropower and Climate variability:Hamlet and Lettenmaier 1999, Cayan et al 2003 iii) Retrospective Analysis 1950-2000:Maurer et al 2002 iv) California summer temperature predictability :Alfaro et al 2005
Outline Episode IV, A New Hope meteorological data hydrologic model reservoir models energy demand model Episode V, VIC strikes back Streamflow and climate Hydropower and climate Electricity demand and climate Episode VI, return to modeling constraints benefits and climate potential for more benefit
A New Hope • Meteorological data • Hydrologic Model • Reservoir Models • Energy Demand Model
The procedure in brief Pre-processing (gridding, climatic trend, etc) Temperature, Precipitation and wind observations Hydrologic Model VIC + Routing Model + Bias Correction Monthly Natural Streamflow Reservoir Model ColSim / CVMod Hydropower
Meteorological Data • Station Data sources : National Climatic Data Center (NCDC) • Extended time series from 1916 to 2003 • Forcing data sets gridded to the 1/8 degree • Adjustment of forcing data sets for orographic effects based on PRISM (Parameter-elevation Regressions on Independent Slopes Model ) approach (Daly and colleagues at Oregon State University) • Adjustment to reflect long-term trends that are present in the carefully quality controlled Hydroclimatic Network (HCN) and a similar network for the Canadian portion of the Pacific Northwest (PNW) region (Hamlet and Lettenmaier 2004)
Hydrologic Model: VIC (1/2) 1/ Water Balance 2/ Runoff Routing
Hydrological Model: VIC (2/3) Simulated Flow = Red Observed = Black
Hydrological Model: VIC (2/3) Simulated Flow = Red Observed = Black
Reservoir Models: CVMod and ColSim • Represent physical properties of the reservoir systems and their operation • Assume fixed level of development • Monthly time step Monthly Natural Streamflow Monthly Natural Streamflow Water Demand Flood Control, Energy Demand CALIFORNIA CVMod (Van Rheenen et al 2004) PACIFIC NORTHWEST ColSim (Hamlet and Lettenmaier 1999) Hydropower Hydropower
Electricity Demand Model • Based on a regression of observed daily average or peak hour load with observed daily maximum temperature 1993-2000, and day type ( week end, national holyday, week day) • Derive 1916-2002 daily and peak hour electricity demand for California and the PNW • More skill in summer time in CA and in wintertime in the PNW
PNW CA
In Brief • 1915-2002 meteorological data set in CA and PNW • 1916-2002 naturalized bias corrected streamflow in CA and PNW • 1917-2002 hydropower time series in CA and PNW • 1917-2002 electricity demand in CA and PNW • 1917-2002 ENSO and PDO climate signals
Episode V, VIC strikes back Observed Covariability Goal: confirm litterature review results with our time series derive new relationships • Streamflow and Climate • Hydropower and Climate • Energy demand and Climate • Hydropower and Energy Demand
Streamflow covariability • Seasonal: North CA and the PNW are out of phase • Interannual based on ENSO and PDO: out of phase
Streamflow Covariability North CA: peak in winter South CA: peak in spring ENSO: 17% annual flow difference PDO: 2%
Streamflow Covariability PNW: peak in early summer ENSO/PDO: 12-16% annual flow difference
Hydropower Covariability PNW: peak in J CA: peak in M
Hydropower Covariability • 53% correlation between PNW and CA hydropower
Energy Demand Covariability I/ Seasonally: Demands are out of phase in CA and in the PNW!! II/ Interannually: ~1% variation of peak or daily electricity demand, underestimation of the variability due to monthly averaging
Climate based predictabilities • Predictable variables • Streamflows • Hydropower • Electricity demand • ENSO and PDO indices • Seasonal timing • Energy demand is out of phase in CA and in the PNW • PNW energy production and energy demand are out of phase • PNW hydropower and CA peak energy demand are in phase • Interannual variability: • Streamflows tend to be out of phase in CA and PNW • Hydropower productions are correlated at 53% • PNW hydropower and CA peak energy demand are in phase
Episode VI, Return To Modeling • Development of the transfer model • Economic benefit • New management timeline
The Pacific NW-SW Intertie • Slightly less than 8000 MW capacity • Reliable transmission • Southward transfer during peak hour • Northward transfer overnight, if needed Notes: • The energy transfer follows the energy demand • Transfers are decided on an hourly basis during the day • Currently climate information is not used in planning West Coast energy transfers
Transfer Model • Based on conservative EXCESS PNW HYDROPOWER estimate ( Production – daily demand) • Assumption: intertie used for California Peak Hour ~ 10 hour/day • Additional Constraints • Capacity: Excess Hydro. <= Intertie Transfer capacity (7500 MW) • Location:Excess Hydro. <= Hydro. Production at The Dalles and John Day • Price:Sell Price <= CA production price with conventionnal resources
A new Timeline • Based on
Conclusions (1) • 1917-2002 retrospective Analysis • CA and PNW hydropower covary 53% of the time • PNW hydropower is predictable using ENSO and PDO indices • Excess PNW hydropower is predictable • Electricity demands are predictable • Electricity tranfers are of the same order of magnitude as the CA hydropower (for a total of up to 20% of CA peak demand) • Predictable economic benefit, averaging $159 and $95 million for CA and the PNW
Conclusions (2) • Perspective for Forecasting • Prediction of next winter ENSO available • California summer electricity demand is predictable using MAM PDO indices (Alfaro et al 2005 and our electricity demand model) • Excess hydropower can be simulated
Meteorological Data : NCDC HCN/HCCD Monthly Data Topographic Correction for Precipitation Correction to Remove Temporal Inhomogeneities Preprocessing Regridding Lapse Temperatures Temperature & Precipitation Coop Daily Data PRISM Monthly Precipitation Maps Extended time series from 1916 to 2003
The scientific question Streams CLIMATE ENSO / PDO Intertie Mutual Benefit Hydropower production Electricity Demand