Download
1 / 24
260 likes | 1.3k Views
Saponification of Ethyl acetate by Sodium hydroxide in a Plug Flow Reactor. Lindsey Kato Shawna Togioka Luke Sugie February 2, 2005. Overview. Project Objectives Project Planning and Execution Background and Experimental Methods Results and Conclusions Recommendations and Future Work.

E N D
Saponification of Ethyl acetate by Sodium hydroxide in a Plug Flow Reactor Lindsey Kato Shawna Togioka Luke Sugie February 2, 2005
Overview • Project Objectives • Project Planning and Execution • Background and Experimental Methods • Results and Conclusions • Recommendations and Future Work
ProjectObjectives • Develop reaction kinetic data for the saponification of ethyl acetate by sodium hydroxide. • Develop calibration curves for electric conductivity cell, using known concentrations of reactants and products • Calibration of pump settings on Plug Flow Reactor (PFR). • Ran Batch Reactor and PFR and gathered kinetic rate data
Project Planning • Roles & Responsibilities • Team Leader – Lindsey Kato • Planning agenda, Assigning tasks and goals, presentation • Operations Coordinator – Shawna Togioka • Knowledge of equipment, data collections and laboratory documentation • Safety Coordinator – Luke Sugie • Hazards of the Lab, chemical safety, MSDS • Group: Background data collection and analysis
Key Planning Elements • Project Plan / Time Table • Learn about the lab, equipment, safety, hazards • Calibration Tests • Batch Reactor Tests • PFR Tests • Analysis • Oral Presentation • Written Reports
Lessons Learned • Some activities take longer than expected • Experiments don’t always run smoothly. Must rethink the experimental design. • Overall – Lab time was utilized and original project plan didn’t need to be altered.
Background Information Reaction: Ethyl acetate+Sodium Hydroxide → Sodium acetate+Ethanol C2H5O2CCH3 + Na-OH → CH3CO2Na + H3C-CH2-OH Theory: -rOH = -dCOH/dt = -dCEt-O-Ac/dt = k*COH*CEt-O-Ac A second order bimolecular reaction. Literature Value1,2: kOH = 0.111 L/mole-sec at 25°C Irreversible reaction
Equipment Conductivity Meter Uses: measured the conductivity in the batch reactions and PFR experiments Preparation: calibrated at beginning of every lab period. Calibration curves were constructed with different concentrations of reactants and products.
Equipment Constant Water Bath -Batch Reaction experiments done at 25°C -Reactants were submerged in the bath to reach temp. and then put together for the experiment.
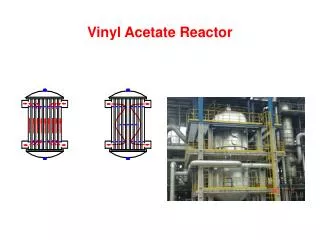
Equipment Plug Flow Reactor -Packed with small spherical balls -Bed Void Fraction3, ε, of ~0.41 -Equimolar concentrations of NaOH and Ethyl Acetate were pumped into PFR -Conductivity meter used to determine the composition of the product stream. -Experiment finished once reaction reached equilibrium.
Experiments • Testing was done on the PFR pumps to determine the resonance time for each pump at different settings. • Calibration curves were generated for the conductivity meter for known concentrations of reactants and products. • Batch reactions were done using equimolar concentrations of reactants. • PFR experiments were done using equimolar concentrations and approx. equal molar flows.
Batch Reactor Experiments • Bath was set to 25°C • Reactants were measured and put in bath separately to heat. • Combined reactants and conductivity measurements taken at 5 and 10 second intervals. • Batches were constantly stirred for the duration of the experiment.
PFR Experiments • Large quantities of equimolar mixture of Ethyl acetate and NaOH were prepared and placed at the inlet for each pump. • The pumps were set so that the flow rates of each of the reactants would be equal. • Conductivity Meter was connected to the PFR at the outlet and readings were taken during the experiment. • Experiment was finished once the conductivity reached a steady state.
Key Equations Batch Reactor COH=CEt-O-Ac Relationship: 1 = k*t + 1 COH COHo PFR COH=CEt-O-Ac Relationship: 1 * XOH = k*ττ = V/vo (Space-time) COH 1-XOH
Results – Conductivity Calibration Measurements were taken with pure NaOH, 50-50% concentration NaOH and Sodium acetate, and pure sodium acetate.
Results – Batch Reactor The kinetic rate constant is the initial slope at the start of the experiment.
Results - PFR The flow rate of the pumps was varied to five different settings for data collection.
Results – Batch and Plug Flow Reactor • Batch Reactor showed a kinetic rate constant of ~0.19 L/mole-sec • Tests showed the rate constant to be 2 times higher than literary value, but was consistent for all trials. • Plug Flow Reactor showed the kinetic rate constant to be ~0.24L/mole-sec • The experimental value was 2.5 times higher than the literary value.
Major Conclusions • The kinetic rate constant for batch is 0.19 L/mole-sec • The kinetic rate constant for a PFR is 0.24 L/mole-sec. • The literary value was 0.111 L/mole-sec • Discrepancies in the experiment and literature could be caused from slightly unequal concentrations, incorrect molar flow rates, or conductivity calibration problems. • Reaction data showed characteristics of being second order as theory predicted.
Lessons Learned • Some activities take longer than expected • Experiments don’t always run smoothly. Must rethink the experimental design. • Overall – Lab time was utilized and original project plan didn’t need to be altered.
Future Recommendations • More careful research done early on, so work in the lab could go more smoothly. • Run more trials on the PFR and batch to confirm data. • Plan out your lab times carefully and set reasonable goals and be safe.
References • Bamford, C.H. and C.F.H. Tipper. 1970. Comprehensive Chemical Kinetics v.10. Elsevier Publishing Company. New York. p.169. • Batch Reactor Kinetic Analysis. Jan 15, 2005. www.csupomona.edu/~tknguyen/che435/Notes/P5-kinetic.pdf • Levenspiel, Octave. 1998. Engineering Flow and Heat Exchange. Plenum Press. New York. p.128.