Download
1 / 9
90 likes | 181 Views
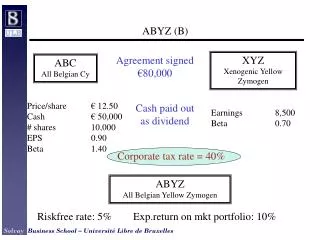
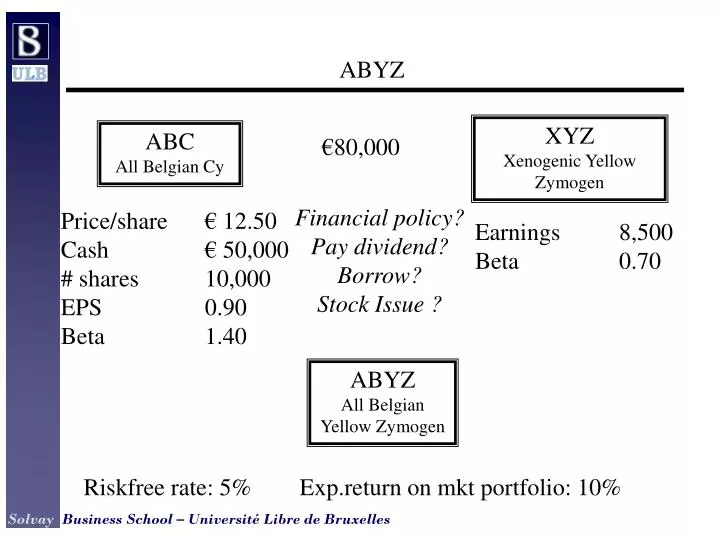
ABYZ. XYZ Xenogenic Yellow Zymogen. ABC All Belgian Cy. €80,000. Financial policy? Pay dividend? Borrow? Stock Issue ?. Price/share € 12.50 Cash € 50,000 # shares 10,000 EPS 0.90 Beta 1.40. Earnings 8,500 Beta 0.70. ABYZ All Belgian Yellow Zymogen.

E N D
ABYZ XYZXenogenic Yellow Zymogen ABCAll Belgian Cy €80,000 Financial policy? Pay dividend? Borrow? Stock Issue ? Price/share € 12.50 Cash € 50,000 # shares 10,000 EPS 0.90 Beta 1.40 Earnings 8,500 Beta 0.70 ABYZAll Belgian Yellow Zymogen Riskfree rate: 5% Exp.return on mkt portfolio: 10%
ABC Expected earnings 9,000 WACC (= 5+5*1.4) 12% PV(Earnings) (9,000/0.12) 75,000 Cash 50,000 Mkt Value 125,000 /# shares 10,000 Price per share 12.50 XYZ Expected earnings 8,500 WACC (=5+5*0.7) 8.50% Mkt Value 7,155/0.135 100,000 Valuing the companies NPV = 100,000 - 80,000 = 20,000 NPV/share = €2 Price per share after announcement = € 14.50
Comparing various financing strategies • No div/DebtDiv/Debt Div/SI • Mkt Val Equity 145,000 95,000 175,000 • Debt 30,000 80,000 0 • Dividend/share 0 5 5 • # shares 10,000 10,000 18,421 • Price per share 14.50 9.50 9.50 • EBIT 17,500 17,500 17,500 • Interest 1,500 4,000 0 • Earnings 16,000 13,500 17,500 • EPS 1.60 1.35 0.95 • Exp.Return Eq. 11.03% 14.21% 10.00% • Beta equity 1.207 1.842 1.000 • WACC 10.00% 10.00% 10.00%
VAN D'UNE ACQUISITION • a. Acquisition Cash • A acquiert B pour 150 (entreprises financées par fonds propres) • A B AB • Valeur 500 100 700 • 1. GAIN = VAB - (VA + VB) = 700 - (500 + 100) = 100 • Les deux firmes fusionnées valent plus que séparées • 2. COUT = Cash – VB = 150 – 100 = 50 • Valeur de la prime de contrôle • 3. VAN = GAIN – COUT = 100 - 50 = 50 • Différence entre le gain de synergie et la prime de contrôle • REMARQUE:Si le marché anticipe une reprise potentielle de B par A, la valeur de marché de B peut refléter les gains potentiels résultant de l'opération. L'ignorer pourrait mener à une sous-évaluation du bénéfice de l'opération.
Paiement en actions • A B AB • Valeur 500 100 700 • # actions 25 10 ? • Prix / action 20 10 ? • Rapport d'échanges : # nombre d’actions A par de B • Supposons un rapport d'échange de 0.75:1 • Coût de l'acquisition : 7.5x20 = 150 ? NON • Nbre d'actions après acquisition : 32.5 • Prix par action 21.54 • Actionnaires initiaux de A 25 actions 539 • Actionnaires anciens de B 7.5 actions 161 • COUT DE L'ACQUISITION = x VAB – VB = 161 – 100 = 61 • x = fraction de l'entreprise AB détenue par les actionnaires B • VAN = VAB -(VA + VB) - (x VAB - VB) = (1 - x) VAB - VA • = ( 700 - 600 ) - (161 – 100) = 539 - 500 = 39
A QUI BENEFICIE UNE ACQUISITON? • Résultats empiriques US • Offre d'acquisiton réussie • Tender offer 30% 4% • Merger 20% 0 • Proxy contest 8% na • Offre d'acquisiton ratées • Tender offer -3% -1% • Merger -3% -5% • Proxy contest 8% na • Source: Jensen and Ruback, "The Market for Corporate Control: The Scientific Evidence" Journal of Financial Economics April 1983
Modes De Paiement Des Operations De Fusions Et Acquisitions • ETATS-UNIS 1977-1982 • Mergers Tenderoffer Not Disclosed TOTAL • CASH 33 59 9 101 • STOCK 32 0 0 32 • MIXED 23 8 5 36 • Not disclosed 13 7 15 35 • TOTAL 101 74 29 204 • Source : Huang and Walking , Target abnormal returns associated with acquisition announcements: Payment, acquisition form, and managerial resistance - Journal of Financial Economics 19, 2 (December 1987)
ETATS-UNIS vs ROYAUME UNI 1955-1985 • UK US • CASH 25.3% 30.6% • EQUITY 24.6% 37.1% • MIXED 31.2% 23.3% • OTHER 18.9% 9% • Source: Franks, Harris and Mayer (1988), Means of Payments in Takerovers: Results for the United Kingdom and the United States' in Auerbach (1988) Corporate Takeovers: Causes and Consequences, Chicago University Press
CONSEQUENCES DU CHOIX DU MODE DE FINANCEMENT • ETATS-UNIS vs ROYAUME UNI 1955-1985 • RENTABILITES ANORMALE (%)? MOIS DE L'ANNONCE • UK US • TARGET BIDDER TARGET BIDDER • T B T B • ALL CASH 30.2 0.07 25.4 2.0 • ALL EQUITY 15.1 - 1.10 11.1 -0.9 • Source: Franks, Harris and Mayer (1988), Means of Payments in Takerovers: Results for the United Kingdom and the United States' in Auerbach (1988) Corporate Takeovers: Causes and Consequences, Chicago University Press • 1. le gain essentiel des opérations se retrouve du côté des actionnaires de l'entreprise acquise; • 2. les actionnaires de l'entreprise acquéreuse réalisent un gain très limité, voir une perte. • 3. les financements par espèce donne des rentabilités anormales plus importantes que le financement par action.