Download
1 / 32
360 likes | 608 Views
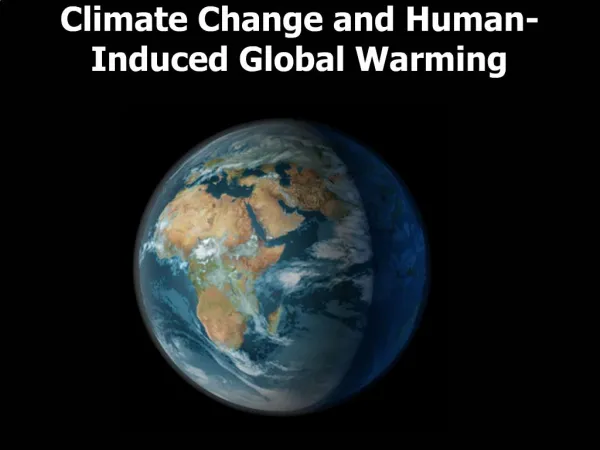
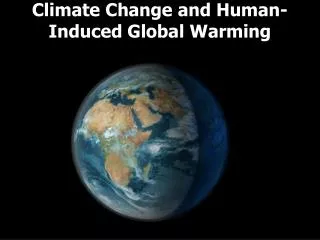
Climate Change and Human-Induced Global Warming. The Greenhouse Effect. A normal climatic warming effect caused by permitting incoming solar radiation but inhibiting outgoing terrestrial radiation. Three gases are the primary cause: Carbon Dioxide (CO 2 ) Methane (CH 4 )

E N D
The Greenhouse Effect • A normal climatic warming effect caused by permitting incoming solar radiation but inhibiting outgoing terrestrial radiation. • Three gases are the primary cause: • Carbon Dioxide (CO2) • Methane (CH4) • Water Vapor (H2O) • The effect is possible because outgoing earth radiation is of much longer wavelengths than incoming insolation and it gets caught or trapped in the atmosphere.
The Greenhouse Effect • Keeps Earth’s average temperature 35ºC warmer (16ºC now, -20 ºC otherwise) • Human role? ‘A heated debate’ Venus 480ºC thick carbon dioxide Mars -62 ºC little carbon dioxide
Now to the most ominous symptom of all: a fever that’s rising fast. The 10 hottest years on record in order: 2010 2005 1998 2003 2002 2009 2006 2007 2004 2001 Source: National Climate Data Center (NOAA). 2011. Global Surface Temperature Anomalies. http://www.ncdc.noaa.gov/
Note that very recent rate of increase greatly exceeds anything in last 1000 years. Source: International Panel on Climate Change (IPCC), 2001
The yellow arrow indicates when the first agricultural towns were built. The Earth’s temperature was remarkably stable over the 10,000 years. Source: Intergovermental Arctic Climate Impact Assessment (ACIA). 2004. http://www.acia.uaf.edu/pages/scientific.html
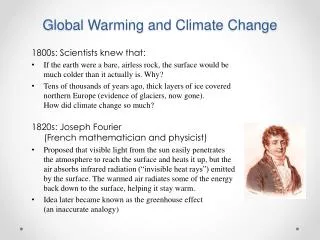
Changes in Temperature and Solar Radiation Milankovitch Cycles explain much (60%+) of the observed temperature changes over hundreds of thousands of years: • 40,000 year cycle: +/- 1.5° change in Earth's tilt • 100,000 year cycle: Orbital eccentricity of the elliptical orbit of the Earth. Shape of the orbit changes. • 21,000 year cycle: perihelion shifts throughout the year The most recent ice age lasted 100, 000 years. We are currently in an interglacial period called the Holocene.
We continue to increase our consumption of fossil fuels. Carbon dioxide levels are still rising in her lungs. Source: Worldwatch Institute. 2007. Vital Signs 2007-2008. Source: U.S. Global Change Research Program. 2009. Global Climate Change Impacts in the U.S. www.globalchange.gov.
How much warmer will it get? Source: U.S. Global Change Research Program. 2009. Global Climate Change Impacts in the U.S. www.globalchange.gov.
Climate models suggest that the changes are just beginning now and will accelerate rapidly.
Global Warming Effects Human-induced rise in CO2 levels is already leading to increased greenhouse forcing and unnatural warming of atmosphere. • Likely future effects: • Increased storminess, more droughts, more intense downpours • More intense hurricanes and, possibly, tornadoes • Rising sea level (.36 to 2.5 feet)in 100 years (IPCC, 2007)* • Loss of farmable land, especially in arid regions • Extinction of thousands of species • Loss of nearly all coral reef • Increased range of tropical diseases • Flooding of low-lying coastal regions * IPCC estimate does not include Greenland Ice Sheet
“Warming of the climate system is unequivocal, as is now evident from observations of increases in global average air and ocean temperatures, widespread melting of snow and ice, and rising global mean sea level. “ IPCC Report, 2007
So is sea level rise happening? How much? Sea level rise is not well understood. In their 2001 report, the Intergovernmental Panel on Climate Change stated that global warming should cause sea levels to rise 0.11 to 0.77 meters (0.36 to 2.5 feet) by 2100. When added to storm surges and high tides, these small changes may have large effects. Moreover, because Greenland’s ice sheet is not well understood it was not included in these estimates. It represents much of the ice on Earth. Source: UN IPCC, 2001 Source: UN IPCC, 2001
Global Warming? Climate change will lead to more chaotic and unpredictable weather:"Climate change will bring warm, wet weather, which will encourage plants to grow, followed by long periods of drought, during which they will burn." - Meinrat Andreae, Max Planck Institute for Chemistry, August 2001.
She is already suffering frequent hot flashes, dehydration, sweats, and chills. Hurricane Katrina, 2005
2012 The yellow line represents 30 year average sea ice minimum extent. Glaciers are melting much faster than predicted.
Extreme weather events are becoming more common; severe droughts, floods, fires, heat waves, blizzards are all increasing in frequency. Sources: Min, S.-K. et al. Nature470, 378-381 (2011); Pall, P. et al. Nature470, 382-385 (2011); Stott, P. A. et al. Nature432, 610-614 Lake Hindmarsh, Victoria, Australia. May, 2007
Difference in average temperature(2000, 2001, 2002 and 2004) from 2003, covering the date range of July 20 - August 20. 40,000 – 50,000 people died as a result of the record heat wave that scorched Europe in August 2003. It was the hottest summer in Europe in 1500 years. France, 2003 Source: Larsen, J. Earth Policy Institute. 2006. Setting the Record Straight: More than 52,000 Europeans Died from Heat in Summer 2003. http://www.earth-policy.org/index.php?/plan_b_updates/2006/update56
One degree of temperature change in the last 100 years has led to four times as many fires in the American West. Station Fire, 2009
Surface water will decrease in the U.S. Southwest. Source: U.S. Global Change Research Program. 2009. Global Climate Change Impacts in the U.S. www.globalchange.gov.
Global temperature change will vary • Sea surface temperatures will also increase as oceans absorb more heat. • May not have more storms, but storms will be stronger and longer
Projected changes in precipitation • High latitudes = increased precipitation • Low and middle latitudes = decreased precipitation will worsen water shortages in developing countries
U.S. Global Change Research Program (2008) Highlighted past effects and predicted future impacts of climate change in U.S.
Are we responsible for climate change? • The IPCC 2007 report concluded that it is more than 90% likely that most global warming is due to humans.* • In 2005, the national academies of 11 nations issued a joint statement urging political leaders to take action. By 2010 more than 30 countries National Academies of Science had such statements. • The debate on climate change is fanned and funded by corporate and oil industry skeptics. The science is clear and unequivocal. * The majority of signatories argued that this figure should have been 99%, but China, among others, protested.