1 / 67

Number of transplants, by donor type figure 8.1

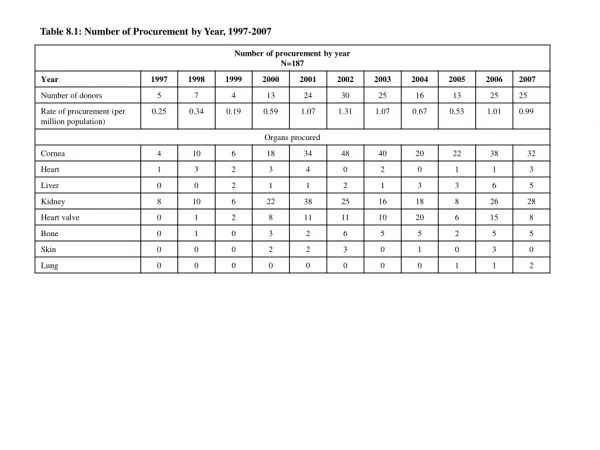
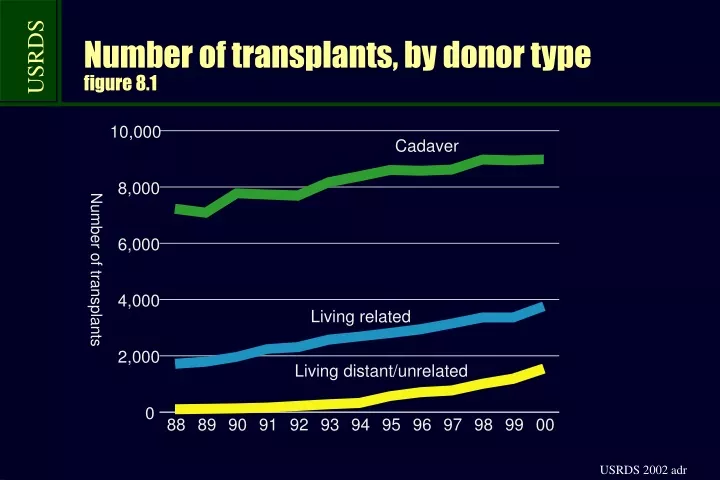
Number of transplants, by donor type figure 8.1. Incident & transplant rates figure 8.2. Transplant rates, by state figure 8.3, 2000, unadjusted. Rate per 100 dialysis patient years 8.9+ (10.9) 6.8 to <8.9 5.3 to <6.8 4.7 to <5.3 below 4.7 (3.9).

etterp
Download Presentation

Number of transplants, by donor type figure 8.1

An Image/Link below is provided (as is) to download presentation Download Policy: Content on the Website is provided to you AS IS for your information and personal use and may not be sold / licensed / shared on other websites without getting consent from its author. Content is provided to you AS IS for your information and personal use only. Download presentation by click this link. While downloading, if for some reason you are not able to download a presentation, the publisher may have deleted the file from their server. During download, if you can't get a presentation, the file might be deleted by the publisher.

E N D

Presentation Transcript


  1. Number of transplants, by donor typefigure 8.1

  2. Incident & transplant ratesfigure 8.2

  3. Transplant rates, by statefigure 8.3, 2000, unadjusted Rate per 100 dialysis patient years 8.9+ (10.9) 6.8 to <8.9 5.3 to <6.8 4.7 to <5.3 below 4.7 (3.9)

  4. Median waiting times, by statefigure 8.4, cadaveric transplants only, 2000, unadjusted Waiting time in days 597+ (692) 472 to <597 399 to <472 322 to <399 below 322 (176) Insufficient data

  5. Trends in transplant waiting times, by age, gender, & racefigure 8.5, cadaveric transplants only

  6. Donation rates, by age, gender, & racefigure 8.6, donors younger than 70

  7. Geographic variations in cadaveric donationsfigure 8.7, donors younger than 70, 1999, by HSA, unadjusted Rate per million population 38.2+ (43.7) 34.8 to <38.2 32.0 to <34.8 29.1 to <32.0 below 29.1 (27.1)

  8. Geographic variations in living donor donationsfigure 8.7, donors younger than 70, 1999, by HSA, unadjusted Rate per million population 20.9+ (26.9) 17.6 to <20.9 15.5 to <17.6 13.6 to <15.5 below 13.6 (12.1)

  9. Organ sharing, by UNOS region & Organ Procurement Organization (OPO)figure 8.8, organs transplanted in 1995-2000

  10. Risk factors for graft survivaltable 8.a

  11. Risk factors for graft survivaltable 8.a (cont.)

  12. Risk factors for graft survivaltable 8.a (cont.)

  13. Risk factors for graft survivaltable 8.a (cont.)

  14. Kaplan-Meier graft survival: transplant erafigure 8.9

  15. First-year graft survival: transplant erafigure 8.10

  16. Conditional half-lives: transplant erafigure 8.11

  17. Kaplan-Meier graft survival: donor typefigure 8.12

  18. First-year graft survival: donor typefigure 8.13

  19. Conditional half-lives: donor typefigure 8.14

  20. Kaplan-Meier graft survival: recipient age figure 8.15

  21. First-year graft survival: recipient age figure 8.16

  22. Conditional half-lives: recipient agefigure 8.17

  23. Kaplan-Meier graft survival: recipient racefigure 8.18

  24. First-year graft survival: recipient racefigure 8.19

  25. Conditional half-lives: recipient racefigure 8.20

  26. Kaplan-Meier graft survival: recipient ethnicityfigure 8.21

  27. First-year graft survival: recipient ethnicityfigure 8.22

  28. Conditional half-lives: recipient ethnicityfigure 8.23

  29. Kaplan-Meier graft survival: recipient primary cause of diseasefigure 8.24

  30. First-year graft survival: recipient primary cause of disease figure 8.25

  31. Conditional half-lives: recipient primary cause of disease figure 8.26

  32. Kaplan-Meier graft survival: recipient education levelfigure 8.27

  33. First-year graft survival: recipient education level figure 8.28

  34. Conditional half-lives: recipient education level figure 8.29

  35. Kaplan-Meier graft survival: recipient employment statusfigure 8.30

  36. First-year graft survival: recipient employment status figure 8.31

  37. Conditional half-lives: recipient employment status figure 8.32

  38. Kaplan-Meier graft survival: primary payorfigure 8.33

  39. First-year graft survival: primary payorfigure 8.34

  40. Conditional half-lives: primary payorfigure 8.35

  41. Kaplan-Meier graft survival: prior dialysis timefigure 8.36

  42. First-year graft survival: prior dialysis time figure 8.37

  43. Conditional half-lives: prior dialysis time figure 8.38

  44. Kaplan-Meier graft survival: donor agefigure 8.39

  45. First-year graft survival: donor agefigure 8.40

  46. Conditional half-lives: donor agefigure 8.41

  47. Kaplan-Meier graft survival: donor genderfigure 8.42

  48. First-year graft survival: donor genderfigure 8.43

  49. Conditional half-lives: donor genderfigure 8.44

  50. Kaplan-Meier graft survival: donor racefigure 8.45

More Related