Download
1 / 26
260 likes | 375 Views
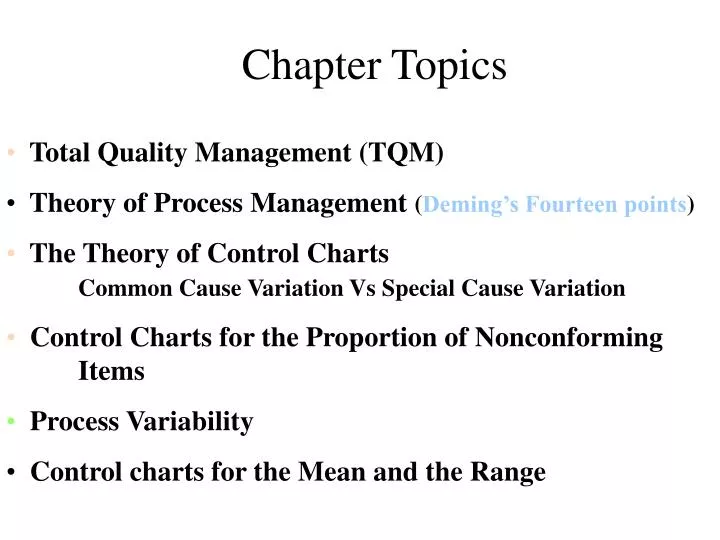
Chapter Topics. Total Quality Management (TQM) Theory of Process Management ( Deming’s Fourteen points ) The Theory of Control Charts Common Cause Variation Vs Special Cause Variation Control Charts for the Proportion of Nonconforming Items Process Variability

E N D
Chapter Topics • Total Quality Management (TQM) • Theory of Process Management (Deming’s Fourteen points) • The Theory of Control ChartsCommon Cause Variation Vs Special Cause Variation • Control Charts for the Proportion of Nonconforming Items • Process Variability • Control charts for the Mean and the Range
Control Charts • Monitors Variation in Data • Exhibits Trend - Make Correction Before Process is Out of control • Show When Changes in Data Are Due to • Special or Assignable Causes • Fluctuations Not Inherent to a Process • Represents Problems to be Corrected • Data Outside Control Limits or Trend • Chance or Common Causes • Inherent Random Variations
Process Control Chart • Graph of sample data plotted over time Assignable Cause Variation UCL Process Average ±3s Mean LCL Random Variation
Control Limits • UCL =Process Average + 3 Standard Deviations • LCL = Process Average - 3 Standard Deviations X UCL + 3s Process Average - 3s LCL TIME
Types of Error • First Type: Belief that Observed Value Represents Special Cause When in Fact it is Due to Common Cause • Second Type: Treating Special Cause Variation as if it is Common Cause Variation
Comparing Control Chart Patterns X X X Special Cause Variation: 2 Points Outside Control Limit Common Cause Variation: No Points Outside Control Limit Downward Pattern: No Points Outside Control Limit
When to Take Corrective Action Corrective Action should be Taken When Observing Points Outside the Control Limits or When a Trend Has Been Detected: • 1. Eight Consecutive Points Above the Center Line (or Eight Below) • 2. Eight Consecutive Points that are Increasing (Decreasing)
p Chart • Control Chart for Proportions • Shows Proportion of Nonconforming Items • e.g., Count # defective chairs & divide by total chairs inspected • Chair is either defective or not defective • Used With Equal or Unequal Sample Sizes Over Time • Unequal sizes should not differ by more than ± 25% from average sample size
p Chart Control Limits LCLp = UCLp = Average Proportion of Nonconforming Items Average Group Size # Defective Items in Sample i _ p # of Samples Size of Sample i
p Chart Example • You’re manager of a 500-room hotel. You want to achieve the highest level of service. For 7 days, you collect data on the readiness of 200 rooms. Is the process in control?
p Chart Hotel Data • # NotDay # RoomsReadyProportion • 1 200 16 0.080 2 200 7 0.035 3 200 21 0.105 4 200 17 0.085 5 200 25 0.125 6 200 19 0.095 7 200 16 0.080
p Chart Control Limits Solution 16 + 7 +...+ 16 k k å å n X i i 1400 121 = i 1 i = 1 = = 200 = = = . 0864 n = p k k 7 1400 å n i i = 1 _ ) ( . 0864 × 1 - 0864 . p ± 3 = . 0864 ± × × 3 200 or ) ( = . 0864 ± . 0596 .0268 , .1460
p Chart Control Chart Solution P UCL 0.15 _ 0.10 Mean p 0.05 LCL 0.00 1 2 3 4 5 6 7 Day
Variable Control Charts: R Chart • Monitors Variability in Process • Characteristic of interest is measured on interval or ratio scale. • Shows Sample Range Over Time • Difference between smallest & largest values in inspection sample • e.g., Amount of time required for luggage to be delivered to hotel room
R Chart Control Limits From Table UCL = D × R R 4 LCL = D × R R 3 Sample Range at Time i k å R i i = 1 R = k # Samples
R Chart Example • You’re manager of a 500-room hotel. You want to analyze the time it takes to deliver luggage to the room. For 7 days, you collect data on 5 deliveries per day. Is the process in control?
R Chart & Mean Chart Hotel Data • Sample SampleDayAverageRange • 1 5.32 3.85 2 6.59 4.27 3 4.88 3.28 4 5.70 2.99 5 4.07 3.61 6 7.34 5.04 7 6.79 4.22
R Chart Control Limits Solution k å R _ i 3 . 85 + 4 . 27 + L + 4 . 22 i = 1 R = = = 3 . 894 k 7 × UCL = D × = 2 . 114 3 . 894 = 8 . 232 R R 4 From Table E.9 (n = 5) × LCL = D × = 0 3 . 894 = 0 R R 3
R Chart Control Chart Solution Minutes UCL 8 _ 6 4 R 2 LCL 0 1 2 3 4 5 6 7 Day
Mean Chart (The X Chart) • Shows Sample Means Over Time • Compute mean of inspection sample over time • e.g., Average luggage delivery time in hotel • Monitors Process Average
Mean Chart Computed From Table _ _ _ _ = X UCL + A × R 2 X _ Sample Mean at Time i _ _ _ R LCL = X - A × 2 X Sample Range at Time i _ k k å å R X _ _ _ i i i = 1 i 1 = and = X R = k k # Samples
Mean Chart Example • You’re manager of a 500-room hotel. You want to analyze the time it takes to deliver luggage to the room. For 7 days, you collect data on 5 deliveries per day. Is the process in control?
R Chart & Mean Chart Hotel Data • SampleSampleDayAverageRange • 1 5.32 3.85 2 6.59 4.27 3 4.88 3.28 4 5.70 2.99 5 4.07 3.61 6 7.34 5.04 7 6.79 4.22
Mean Chart Control Limits Solution _ k å X _ _ i 5 . 32 + 6 . 59 + L + 6 . 79 i = 1 X = = = 5 . 813 k 7 k å R From Table E.9 (n = 5) _ i 3 . 85 + 4 . 27 + L + 4 . 22 i = 1 R = = = 3 . 894 k 7 _ _ _ _ UCL × = X + A × R = 5 . 813 + 0 . 577 3 . 894 = 8 . 060 2 _ X _ _ × _ LCL X - A × R = 5 . 813 - 0 . 577 3 . 894 = 3 . 566 = 2 X
Mean Chart Control Chart Solution Minutes UCL 8 _ _ 6 X 4 LCL 2 0 1 2 3 4 5 6 7 Day