Download
1 / 16
160 likes | 310 Views
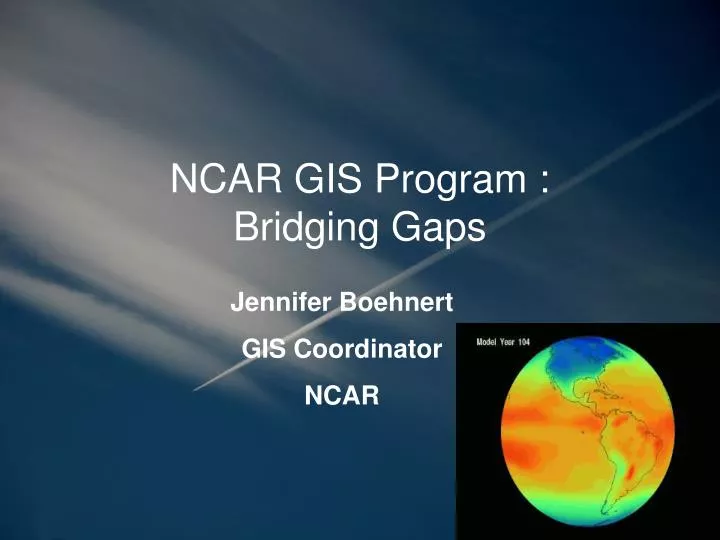
NCAR GIS Program : Bridging Gaps. Jennifer Boehnert GIS Coordinator NCAR. Scope of work. Animation. NCAR GIS Program. Education, Training & User Support. Data Integration & Distribution. Research In GIS Technology. Research Enabled by By GIS. Building Community.

E N D
NCAR GIS Program :Bridging Gaps Jennifer Boehnert GIS Coordinator NCAR
Scope of work • Animation
Education, Training & User Support Data Integration & Distribution Research In GIS Technology Research Enabled by By GIS Building Community Goals and program elements • Conduct research integrating the Earth system and social sciences through spatial analysis and interoperability of georeferenced information; • Support the use of GIS as both an analysis, and an infrastructure tool in atmospheric research; • Improve usable science and knowledge sharing between science groups, educators and stakeholders.
2004 2005 2006 Atmospheric Data Model • Working dialog between ESRI and weather and climate community: • Five workshops in 2004-2008 • The goal is seamless integration of atmospheric and oceanographic data: • Observations • Products • Infrastructure Collaborators: NCAR, Unidata/UCAR, NWS. NOAA NCDC, University of Oklahoma, Pacific Marine Environment Lab, National Marine Fisheries Service, NASA Jet Propulsion Laboratory, ESRI, George Mason University Team Atmosphere (150 members) http://www.gis.ucar.edu/sig Data Modeling Group: http://swiki.ucar.edu/atmosgis
Satellite Images - Raster Radar - Polygons Observations Mobile Obs – Points Surface - Points Weather Events Atmospheric Boundaries Products Climate Variables Numerical Models Human Elements Infra Earth Surface The Thematic Layers
NetCDF in ArcGIS • Adopting NetCDF CF data format by ESRI GIS software • Since 2006 release of ArcGIS 9.2 NetCDF CF format can be read in GIS • Opens atmospheric and oceanographic data to millions of GIS users
Climate change on the map • Distributing CCSM IPCC projections (monthly averages) in a GIS format • GIS – a tool of many stakeholders (land and resource management) http://www.gisclimatechange.org
Who is using CCSM projections? Biomass potential Salmon conservation Resource management Climate change education Vegetation ecology Water resources Agriculture Vulnerability of population and ecosystems Human health Energy ~2500 users from 108 countries Users: Research; Education; Government; GIS; Environmental; Military and defense; Industry; Regional planning and economic development; Native American Tribes, Other…
From 155 km to 4.5 km grid cell Monthly temperature and precipitation projections for the continental U.S. Statistical downscaling method using PRISM (Parameter-elevation Regressions on Independent Slopes Model), dataset for derivation of a regression coefficients Statistical downscaling of CCSM runs 20C3M 1 Jan 1896 Tas celsius
New Products • Annual and seasonal averages • Available by fall • Anomaly – change • Present – 2030 • Present – 2050 • Present – 2099 • PPT –total precipitation • TAS – air temperature
Extreme Weather Application • Develop an interactive web mapping application which integrates weather forecast models with socio-economic and infrastructure data • Making weather models more useful and understandable for non-meteorologists • Communicate the impacts from extreme weather events
Visualization • Dynamically adds netCDF WRF Hurricane model through ArcGIS Server • Using ArcGIS Online free map as background • Symbolized based on hurricane wind scale (Saffir-Simpson Wind Scale) and accumulated rain.
Population Impacts • Find all people who will be effected by winds greater than 70 mph from 12:00 – 5:00 AM Sept 13th.
GIS Program THANK YOU boehnert@ucar.edu http://www.gis.ucar.edu