Download
1 / 11
110 likes | 207 Views
Automated Performance Measures for Snow & Ice Results Ron Beane, Performance Measurement Administrator Office of Maintenance, Iowa DOT Highway Division Ronald.Beane@dot.state.ia.us 515-233-7902 Discussion Question Relative Locations of Automatic Traffic Recorders [ Speed]

E N D
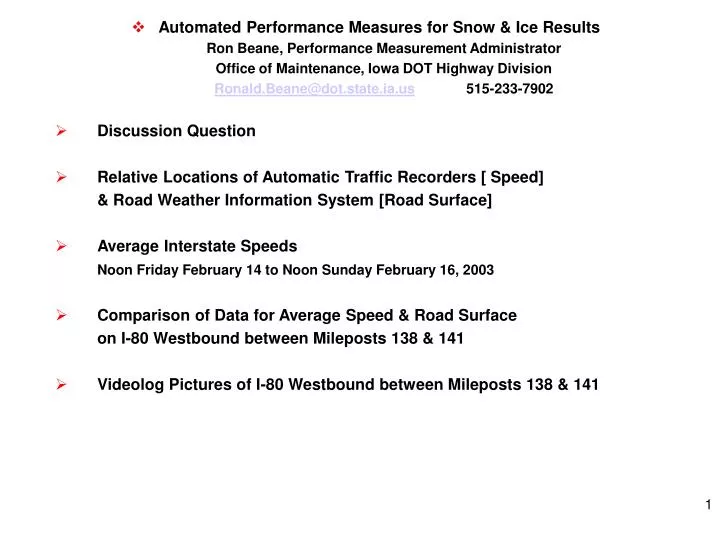
Automated Performance Measures for Snow & Ice Results Ron Beane, Performance Measurement Administrator Office of Maintenance, Iowa DOT Highway Division Ronald.Beane@dot.state.ia.us 515-233-7902 • Discussion Question • Relative Locations of Automatic Traffic Recorders [ Speed] & Road Weather Information System [Road Surface] • Average Interstate Speeds Noon Friday February 14 to Noon Sunday February 16, 2003 • Comparison of Data for Average Speed & Road Surface on I-80 Westbound between Mileposts 138 & 141 • Videolog Pictures of I-80 Westbound between Mileposts 138 & 141
Automated Performance Measures for Snow & Ice Results • Question: Will a comparison of existing data sources provide useful measures or indicators of the results of snow and ice operations with no additional data collection costs? • Possible Data Sources: • Speed data from Automatic Traffic Recorders [ATR] • Road surface and weather data from the Road Weather Information System [RWIS] • Physical layout from videolog pictures • Data: Data from one large statewide storm indicate that drivers’ perceptions indicated by average speed are compatible with road surface measurements. Videolog pictures of the site with the slowest recovery of average speed show physical features that might indicate contributing factors to the recovery time. • Discussion: The sites shown on “Average Interstate Speeds” are listed from west to east on I-80, with the exception of Ankeny on I- 35 a short distance north of the Altoona sites. The speed recovery time for Altoona eastbound was noticeably faster than Altoona westbound. The pictures of Altoona westbound show the vegetation and embankments near the north edge of the roadway and the concrete barrier wall dividing the highway.
Automatic Traffic Recorder & Road Weather Information System Locations
Average Interstate SpeedsNoon Friday February 14 to Noon Sunday February 16, 2003