Download
1 / 13
130 likes | 271 Views
Self-Tuning the Parameter of Adaptive Non-Linear Sampling Method for Flow Statistics. Author: Chengchen , Bin Liu Publisher: International Conference on Computational Science and Engineering Presenter: Yun -Yan Chang Date: 2012/04/18. Introduction.

E N D
Self-Tuning the Parameter of Adaptive Non-LinearSampling Method for Flow Statistics Author: Chengchen, Bin Liu Publisher: International Conference on Computational Science and Engineering Presenter: Yun-Yan Chang Date: 2012/04/18
Introduction • Flow statistics is a basic task of passive measurement and has been widely used to characterize the state of the network. • Adaptive Non-Linear Sampling (ANLS) is one of the most accurate and memory-efficient flow statistics method proposed recently. • This paper studies the parameter setting problem for ANLS. • Proposed a parameter self-tuning algorithm which enlarges the parameter to a equilibrium tuning point and renormalizes the counter when it overflows.
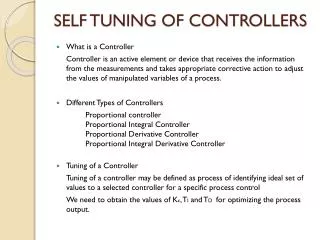
ANLS • A method that adjusts the sampling rate according to the counter value. • No prediction or estimation of flow size distribution is required beforehand. • The counting process can be presented as c ← c + 1 with probability p(c) • c : the counter value • , 0 < a < 1. • Estimate flow length can be formulated as f(c)=[(1+a)c-1]/a. • Relative error of flow size can be presented as . • n: real flow size
Problem Statement • Two major performance metrics for flow statistics: • Relative error • Measures the accuracy of a flow statistics method and can be quantified by coefficient of variation as shown in (3) for ANLS • Counting range (related to memory consumption) • The largest flow size that a flow statistics method could record. • For ANLS, the counting range is B=[(1+a)c-1]/a.
Problem Statement • Tradeoff between small relative error and large counting range Fig. 1. Relative error vs. parameter a when flow size n = 5000. Fig. 2. Counting range vs. parameter a when the largest counter value is 256 (the counter is 8-bit width).
Parameter Self-Tuning Algorithm • When a counter overflows, a is adjusted from a1 to a larger value a2, and renormalized to a smaller value according to the reconfigured a2.
Equilibrium Tuning Point • Determine the equilibrium point for tuning the parameter. • Accuracy utility (Ue) • e1 and e2 are the relative error before and after the parameter tuning. • Counting Range Utility (Ub) • B1 and B2 are the counting range before and after the parameter tuning.
Equilibrium Tuning Point Fig. 3. Finding the equilibrium tuning point.
Renormalization • To keep the inverse estimations before and after the tuning is the same. • Suppose the counter value and parameter before tuning is c1 and a1, after tuning is c2 and a2, the estimations are: • (13) and (14) provide the same estimation
Renormalization • To keep the inverse estimations before and after the tuning is the same. The counter is renormalized to with probability x - , and is reset to with probability 1 − (x− ).
Evaluation • Prove that the renormalization process does not introduce error and ensure the estimation is the same before and after renormalization. • Theorem: The expect error in renormalization process is zero. • Proof: Let From the Algorithm 3, the expected value of c2can be formulated as E(c2) = (X − ) + (1 − X + ) = X Namely, f(E(c2)) = f(c1).
Evaluation • Growth of ANLS with and without counter renormalization. Fig.4 Grow of the counter value
Evaluation • Relative error of ANLS with and without parameter tuning under different traffic scenarios.