Download
1 / 59
730 likes | 1.34k Views
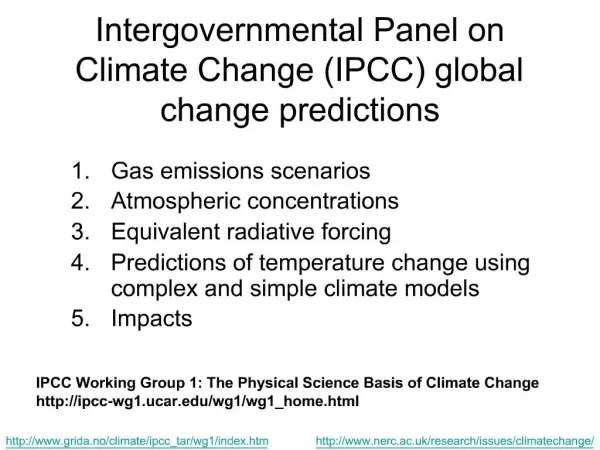
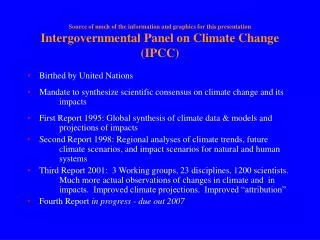
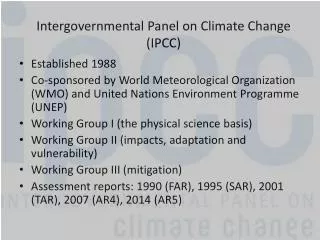
Intergovernmental Panel on Climate Change (IPCC). Established by the UN and World Meteorological Organization in 1988 Role of the IPCC: to assess the scientific, technical, and socio-economic information relevant for the understanding of the risks of human-induced climate change.

E N D
Intergovernmental Panel on Climate Change (IPCC) • Established by the UN and World Meteorological Organization in 1988 • Role of the IPCC: to assess the scientific, technical, and socio-economic information relevant for the understanding of the risks of human-induced climate change. • Assessments based on published and peer-reviewed literature
Intergovernmental Panel on Climate Change (IPCC) • 2,500 of the world’s leading climate scientists and technical experts contribute to reports • Provides comprehensive and balanced assessments of climate change science, impacts, and adaptation and mitigation options • Extensive peer-review and governmental review ensures scientific credibility and policy relevance
Intergovernmental Panel on Climate Change (IPCC) Plenary IPCC Secretariat WMO/UNEP Switzerland Working Group I Climate change science Working Group II Impacts, adaptation and vulnerability Working Group III Mitigation Task force on national greenhouse gas inventories Technical support unit (TSU) in United Kingdom TSU in United States TSU in The Netherlands TSU in Japan Experts, authors, contributors, reviewers Source: Redrawn from Vital Climate Graphics
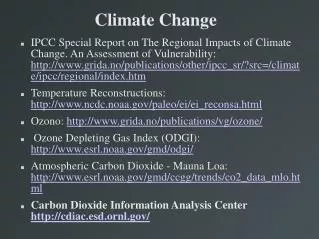
IPCC Assessment Reports • Standard reference work • First Assessment Report (FAR) - published in 1990 • Projected increase in temperature of 3 - 8 °F • Consequences: rising sea levels, increase in extreme weather events, serious pressure on aquatic and terrestrial ecosystems • “The size of the warming is broadly consistent with predictions of climate models, . . . but the unequivocal detection of the enhanced greenhouse effect from observations is not likely for a decade or more.”
IPCC Assessment report foci 1990 1995 2001
IPCC Second Assessment Report Conclusions • Climate has changed over the past century • Global mean surface air temperature has increased .5-1oF • Global sea level has risen 4-10 inches • Global precipitation over land has increased 1% • “ Human signal still building . . . Nevertheless, the balance of evidence suggests a discernible human influence on global climate.”
IPCC Second Assessment Report Conclusions • Climate has changed over the past century • Global mean surface air temperature has increased .5-1oF • Global sea level has risen 4-10 inches • Global precipitation over land has increased 1% • “ Human signal still building . . . Nevertheless, the balance of evidence suggests a discernible human influence on global climate.” • Climate is expected to continue to change in the future • Projected temperature increase of 1.8-6.3oF by 2100 • Projected sea-level rise of 6-37 inches by 2100 • Likely increase in extreme weather events
Kyoto Protocol • SAR provided key input to the negotiations that led to the adoption of the Kyoto Protocol in 1997 • Is an international agreement that establishes binding targets for reduction of greenhouse gases emitted by developed countries.
Emission Scenarios • SAR - used scenarios developed in 1992, known as the IS92 series • Alternative projections of population, affluence, and technological change were used to come up with a range of future GHG emission scenarios • 1995 - IPCC evaluated the IS92 scenarios, recommended that a new set of scenarios be developed - Special Report on Emission Scenarios • TAR - projections are underlain by the full range of SRES scenarios
Third Assessment Report of the IPCC • Published in 2001 • Emphasizes information from the last 5 years • Places climate change in the context of sustainable development, emphasizing equity issues • Policy relevant, but not policy prescriptive
IPCC Third Assessment ReportKey Findings of Working Group I “An increasing body of observations gives a collective picture of a warming world and other changes in the climate system.”
Variations of the Earth’s Surface Temperature* *relative to 1961-1990 average Source: IPCC TAR 2001
Global Annual Temperature Trends: 1901 - 1990 Source: Watson 2000
U.S. Temperature Trends: 1901 to 1998 Red circles = warming; Blue circles = cooling All stations/trends displayed regardless of statistical significance. Source: National Climatic Data Center/NESDIS/NOAA
U.S. Precipitation Trends: 1901 to 1998 Green•= increasing, Brown•= decreasing All stations/trends displayed regardless of statistical significance Source: National Climatic Data Center/NESDIS/NOAA
Extreme Precipitation Events in the U.S. Source: Karl, et.al. 1996.
Increase in frequency and intensity of droughts Source: OSTP
Global average sea level has risen and ocean heat content has increased
IPCC Third Assessment ReportKey Findings of Working Group I “Emissions of greenhouse gases and aerosols due to human activities continue to alter the atmosphere in ways that are expected to affect the climate.”
Indicators of the Human Influenceon the Atmosphere during the Industrial Era Source: IPCC TAR 2001
IPCC Third Assessment ReportKey Findings of Working Group I “Confidence in the ability of models to project future climate has increased.”
IPCC Third Assessment ReportKey Findings of Working Group I “There is new and stronger evidence that most of the warming observed over the last 50 years is attributable to human activities.”
IPCC Third Assessment ReportKey Findings of Working Group I “Human influences will continue to change atmospheric composition throughout the 21st century.”
IPCC Third Assessment ReportKey Findings of Working Group I “Global average temperature and sea level are projected to rise under all IPCC scenarios.”
Main Findings of WG I • Extensive and wide-spread evidence that the earth is warming; we are already seeing the first clear signals of a changing climate. • Human activities are changing the atmospheric concentrations of greenhouse gases. • New and stronger evidence of a human influence on climate. • Global temperature will rise from 2.5 to 10.4°F over this century. Precipitation patterns will change, sea level will rise and extreme weather events will increase. • Human influence will continue to grow during the next century unless measures are taken to reduce GHG emissions.
IPCC History: Evolution of Our Knowledge • FAR (1990): “The size of the warming is broadly consistent with predictions of climate models, . . . but the unequivocal detection of the enhanced greenhouse effect from observations is not likely for a decade or more.” • SAR (1996): “The balance of evidence suggests a discernible human influence on climate.” • TAR (2001): “There is new and stronger evidence that most of the warming observed over the last 50 years is attributable to human activities.”
Data vs. Models in Science Data tell us about the past • But in nonlinear systems (like climate), past trends not necessarily predictive of future Models project the future • Connect theory with data • Can work with nonlinear systems But how do we know models are correct? • Right answers for wrong reasons
Climate Models 3-dimensional mathematical simulations • based on “first principles”: physical equations of motion and state • transport of heat, moisture, energy • grids (4-5° latitude, or 400-500 km) • time steps (15-30 minutes) • long-term simulations (years to centuries) Computationally expensive • hundreds of supercomputer hours per run
General Circulation Models • Governed by physics: • Law of Continuity • Equation of State • - Conservation of energy • Conservation of momentum • Input: solar forcing, Earth rotation, seasons, initial conditions, greenhouse gas levels • Output: temperature, precip, pressures, winds, ocean currents, heat transport, deep ocean circulation…
Run a GCM on your computer?http://www.edgcm.org/ One “experiment” takes 3-4 days of cpu time
The A1 storyline and scenario family describes a future world of very rapid economic growth, low population growth, and the rapid introduction of new and more efficient technologies. Major underlying themes are convergence among regions, capacity building, and increased cultural and social interactions, with a substantial reduction in regional differences in per capita income. The A2 storyline and scenario family describes a very heterogeneous world. The underlying theme is self-reliance and preservation of local identities. Fertility patterns across regions converge very slowly, which results in high population growth. Economic development is primarily regionally oriented. The B1 storyline and scenario family describes a convergent world with the same low population growth as in the A1 storyline, but with rapid changes in economic structures toward a service and information economy, with reductions in material intensity, and the introduction of clean and resource-efficient technologies. Global solutions to economic, social, and environmental sustainability, including improved equity, but without additional climate initiatives. The B2 storyline and scenario family describes a world in which the emphasis is on local solutions to economic, social, and environmental sustainability. It is a world with moderate population growth, intermediate levels of economic development, and less rapid and more diverse technological change than in the B1 and A1 storylines. While the scenario is also oriented toward environmental protection and social equity, it focuses on local and regional levels.
CO2 and SO2 in the 21st Century Source: IPCC TAR 2001
Temperature Projections Global average temperature is projected to increase by 1.4 - 5.8°C by 2100 Projected temperature increases are greater than those in the SAR Projected rate of warming is unprecedented for last 10,000 years Source: IPCC TAR 2001
Variations of the Earth’s Surface Temperature - 1000 to 2100 1000AD to 1861, N. Hemisphere, proxy data 1861 to 2000, Global, instrumental 2000 to 2100, SRES projections Source: IPCC TAR 2001
Projected Changes in Annual Temperatures for the 2050s The projected change is compared to the present day with a ~1% increase per year in equivalent CO2 Source: The Met Office. Hadley Center for Climate Prediction and Research
A probabilistic view… “With the climatological probability of a hot summer represented by two faces (say painted red) of a six-faced die, judging from our model by the 1990s three or four of the six die faces will be red. It seems to us that this is a sufficient ‘loading’ of the dice that it will be noticeable to the man in the street.” Hansen et al., J. Geophys. Res. 93, 9341-9364, 1988.
Metro NYC region: Impact study 31 counties in 3 states (NY, NJ, CT) 21 million residents 13,000 square miles Variety of pop densities & land uses
Estimated Increases in Ozone Excedences ( 1 hour >120 ppb) for the New York Metro Region by 2050 (+315%) (+122%) (+749%) (from C. Hogrefe et al, 2003)
Temperature & Mortality Relationship in 11 Eastern US Cities (Curreiro et al, 2002)
Public Health Impacts(PHI) Model Census 2000 county pop
Public Health Impacts(PHI) Model 1990-1999 average annual non-heat-rel mortality risk
Public Health Impacts(PHI) Model (# days > MMT range)* (average #degrees F above MMT range on those days) Source: R Goldberg & C Rosenzweig, NASA-GISS
Public Health Impacts(PHI) Model 1.305% increase RR mortality per deg F>MMT range (“hot slope”)
Public Health Impacts(PHI) Model Additional # impacts (e.g. deaths) from env change
NYC “optimal mortality temperature range” ~ 53.14 F – 73.54 F from Curreiro et al. (2002 revision, ms. submitted) Relative Risk of Mortality Average Daily Temperature (deg F)