Download
1 / 16
180 likes | 542 Views
The regression coefficient is a measure of the slope of the regression line. A very good fit of the regression line to the data points confirms a causal relationship between x and y . A negative regression coefficient implies a negative coefficient of determination.

E N D
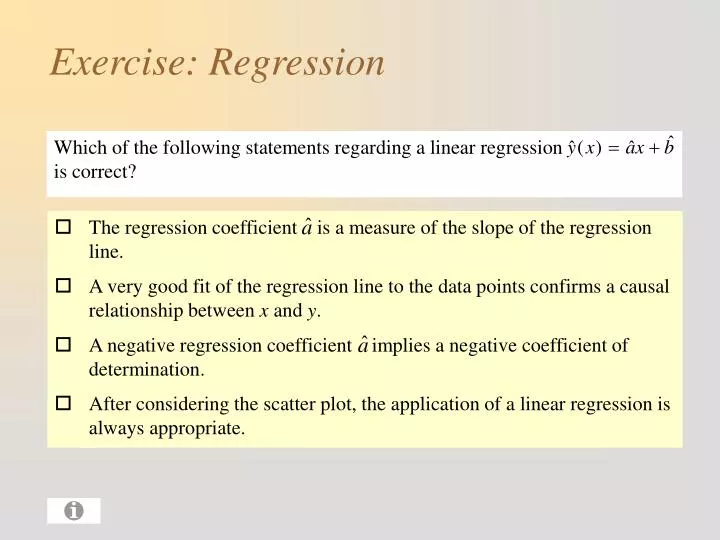
The regression coefficient is a measure of the slope of the regression line. A very good fit of the regression line to the data points confirms a causal relationship between x and y. A negative regression coefficient implies a negative coefficient of determination. After considering the scatter plot, the application of a linear regression is always appropriate. Exercise: Regression Which of the following statements regarding a linear regression is correct?
The regression coefficient is a measure of the slope of the regression line. A very good fit of the regression line to the data points confirms a causal relationship between x and y. A negative regression coefficient implies a negative coefficient of determination. After considering the scatter plot, the application of a linear regression is always appropriate. Exercise: Regression Which of the following statements regarding a linear regression is correct?
It was shown that the new drug is effective in less than 5% of the cases. It was shown that the new drug is ineffective in comparison to placebo. It was shown that the new drug is ineffective in at least 95% of the cases. An efficacy of the new drug in comparison to placebo could not be shown. An efficacy of the new drug in comparison to placebo could only be shown in 27% of all cases. Exercise: Statistical tests The efficacy of a new drug in comparison to placebo was statistically tested in a clinical trial. The test result was not significant (p = 0.27, a = 0.05). What is the right interpretation?
It was shown that the new drug is effective in less than 5% of the cases. It was shown that the new drug is ineffective in comparison to placebo. It was shown that the new drug is ineffective in at least 95% of the cases. An efficacy of the new drug in comparison to placebo could not be shown. An efficacy of the new drug in comparison to placebo could only be shown in 27% of all cases. Exercise: Statistical tests The efficacy of a new drug in comparison to placebo was statistically tested in a clinical trial. The test result was not significant (p = 0.27, a = 0.05). What is the right interpretation?
The t-test must not be applied since the K-S-test indicated a significant deviation from the normal distribution. The difference of the variables A and B is normally distributed. Based on the specification of the relative reduction, the tendency to prescribe the drug is significantly more than 25 percent points greater. • Based on the specification of the relative reduction, the tendency to prescribe the drug is significantly more than 45,1 percent points greater. Exercise: Statistical tests 80 statistically well-educated students were asked about their tendency in percent to prescribe a drug based on a statement of the (A) relative or the (B) absolute cardiac event reduction of the drug. The difference of the variables A-B was tested with the Kolmogorov-Smirnov-Test with respect to normal distribution (p = 0.184). The sample mean difference was 45,1 and the one-sample t-test with a test value of 25 provided p < 0,001. What does it mean?
The t-test must not be applied since the K-S-test indicated a significant deviation from the normal distribution. The difference of the variables A and B is normally distributed. Based on the specification of the relative reduction, the tendency to prescribe the drug is significantly more than 25 percent points greater. • Based on the specification of the relative reduction, the tendency to prescribe the drug is significantly more than 45,1 percent points greater. Exercise: Statistical tests 80 statistically well-educated students were asked about their tendency in percent to prescribe a drug based on a statement of the (A) relative or the (B) absolute cardiac event reduction of the drug. The difference of the variables A-B was tested with the Kolmogorov-Smirnov-Test with respect to normal distribution (p = 0.184). The sample mean difference was 45,1 and the one-sample t-test with a test value of 25 provided p < 0,001. What does it mean?
Assign each boxplot the corresponding histogram! 1 - …… 2 - …… 3 - …… Exercise: Descriptive statistics
Assign each boxplot the corresponding histogram! 1 - D 2 - A 3 - B Exercise: Descriptive statistics
0,5% false positive and 0,5% false negative 1,0% false positive and 1,0% false negative 2,5% false positive and 0,5% false negative 0,5% false positive and 2,5% false negative 5,0% false positive and 1,0% false negative 1,0% false positive and 5,0% false negative Exercise: Normal distribution A normally distributed lab value should be used for the diagnosis of a disease. Both mean and standard deviation are known for diseased (m = 150, s = 10) and healthy subjects (m = 80, s = 20). Determine the approximate proportion of false positive and false negative test decisions if values less than 120 define a test negative diagnosis.
0,5% false positive and 0,5% false negative 1,0% false positive and 1,0% false negative 2,5% false positive and 0,5% false negative 0,5% false positive and 2,5% false negative 5,0% false positive and 1,0% false negative 1,0% false positive and 5,0% false negative Exercise: Normal distribution A normally distributed lab value should be used for the diagnosis of a disease. Both mean and standard deviation are known for diseased (m = 150, s = 10) and healthy subjects (m = 80, s = 20). Determine the approximate proportion of false positive and false negative test decisions if values less than 120 define a test negative diagnosis.
Exercise: Diagnostic tests 356 subjects of a high-risk group were tested by means of the ELISA-test with respect to an HIV infection. 93 persons were HIV infected in reality. The ELISA-test yielded 86 test-positive results, where 76 of these results were correct. Please complete the following crosstab!
Exercise: Diagnostic tests 356 subjects of a high-risk group were tested by means of the ELISA-test with respect to an HIV infection. 93 persons were HIV infected in reality. The ELISA-test yielded 86 test-positive results, where 76 of these results were correct. Please complete the following crosstab!
Exercise: Diagnostic tests 356 subjects of a high-risk group were tested by means of the ELISA-test with respect to an HIV infection. 93 persons were HIV infected in reality. The ELISA-test yielded 86 test-positive results, where 76 of these results were correct. Please complete the following crosstab!
Exercise: Diagnostic tests 356 subjects of a high-risk group were tested by means of the ELISA-test with respect to an HIV infection. 93 persons were HIV infected in reality. The ELISA-test yielded 86 test-positive results, where 76 of these results were correct. Please complete the following crosstab!
yes no Explanation: Exercise: Confidence interval In 1999, a study was published in the New England Journal of Medicine, where the association of symptomatic gastroesophageal reflux and esophageal adenocarcinoma was studied. The odds-ratio (case by control group) was 1,1. The 95% confidence interval of the odds-ratio wasfrom 0,7 to 1,9. Could the authors show a significant association of symptomatic gastroesophageal reflux and esophageal adenocarcinoma with a confidence level of 95%? Explain briefly!
yes no Explanation: The observed better outcome of the sample control group cannot be generalized to the entire population at a level of 95% since the confidence interval covers the value of one (equality of chances). Exercise: Confidence interval In 1999, a study was published in the New England Journal of Medicine, where the association of symptomatic gastroesophageal reflux and esophageal adenocarcinoma was studied. The odds-ratio (case by control group) was 1,1. The 95% confidence interval of the odds-ratio wasfrom 0,7 to 1,9. Could the authors show a significant association of symptomatic gastroesophageal reflux and esophageal adenocarcinoma with a confidence level of 95%? Explain briefly!