Download
1 / 21
210 likes | 352 Views
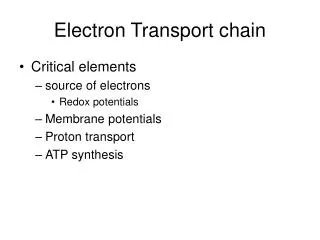
Errors in evaluating chemistry transport models with UV/Vis satellite retrievals: how to avoid them?. Folkert Boersma, Geert Vinken, and Patricia Castellanos,. GOME annual changes in tropospheric NO 2. 1996 - 2002. Quality of satellite retrievals – consistent trends. Differences <10%.

E N D
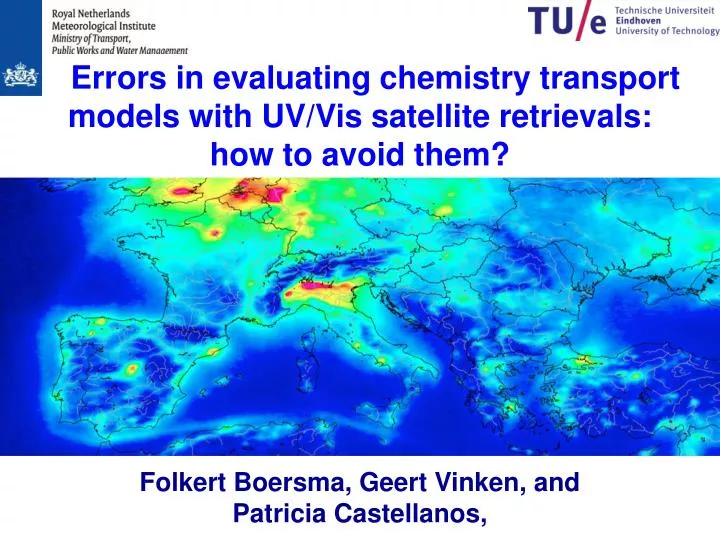
Errors in evaluating chemistry transport models with UV/Vis satellite retrievals: how to avoid them? Folkert Boersma, Geert Vinken, and Patricia Castellanos,
GOME annual changes in tropospheric NO2 1996 - 2002 Quality of satellite retrievals – consistent trends Differences <10% wavelength • 7 years of GOME satellite data • DOAS retrieval + CTM-stratospheric correction • seasonal and local AMF based on 1997 MOZART-2 run • cloud screening Scattering b Earth surface and by atmosphere Pros: Courtesy A. Richter Richter et al., Nature, 2005
Quality of satellite retrievals - intercomparisons Example: two different OMI NO2 retrievals (NASA GSFC & KNMI) History:v1: different retrieval approaches v2: convergence in approach with recent updates to - similar a priori NO2 profiles (from GMI, TM4) - same surface albedo, cloud corrections - similar stratospheric corrections Scattering b Earth surface and by atmosphere Pros: v2: differences within 15% Cons: v1(Lamsal et al., JGR, 2010)
Evaluating models with satellite measurements Model errors and retrieval errors usually taken into account for data assimilation and inverse modeling applications • Model errors: • Model meteorology • Gaseous and heterogeneous reaction rates (e.g. γN2O5, γHO2) • Aerosol properties • Other emissions • Timing emissions • Sub-grid scale effects • Retrieval errors: • Spectral fitting • Background corrections • A priori assumptions Lin et al., ACPD, 2012: 20-40% too low Müller et al., prep., 2012: 50% effects Boersma et al., AMT, 2011: ± 20-30% Validation studies: ± 15%
Evaluating models with satellite measurements • Model errors and retrieval errors usually taken into account • But we also need to account for comparison errors • Models • Temporal and spatial smoothing is intrinsic to models because of finite timestep & spatial resolution • Satellite measurements • Snapshots at a particular (local) overpass time • Resolve small (sub-grid) scale variability • The best way to compare CTM with satellite obs. is: • by close approximation of the spatial coverage achieved by the satellite, and • to sample the CTM on the same day and same overpass time as valid satellite retrievals, • Take into account verticalsensitivity of the retrieval
1. When do we have sufficient valid satellite observations? All pixels cloudy No meaningful comparison possible 2.5° 2.5°
1. When do we have sufficient valid satellite observations? All pixels cloudy No meaningful comparison possible 2.5° 2.5° All pixels clear Straightforward comparison from spatially fully representative average
1. When do we have sufficient valid satellite observations? All pixels cloudy No meaningful comparison possible 2.5° 2.5° Some pixels clear How representative is the average still?
Representativeness error as a function of fractional coverage 3° x 2° TM5 grid cell over New York City with full coverage Compute average by artificially reducing fractional coverage…
Representativeness error as a function of fractional coverage (3° x 2°) For daily comparisons, reduced coverage by 0.5 implies a 11% rep. error f = 1.0 for n = 114 pixels For monthly comparisons, this rep. error can be reduced by ~1/sqrt(d) with d the number of days with sufficient coverage For 0.5 coverage, rep. error < 15% For 0.1 coverage, rep. error < 35%
2. Need to sample for clear-sky days only. Yes, this introduces a clear-sky bias in both model and satellite averages … but avoids large errors in retrievals in cloudy situations Clear-sky bias (NO2): Generally lower concentrations because of higher JNO2, [OH] Proper sampling of model thus avoids this representation error 10-40% M = (1-w) Mclear + w Mcloud
3. Take into account vertical sensitivity Eskes and Boersma, ACP, 2003 Apply averaging kernel • Replace a priori profile by model profile • This is equivalent to calculating new AMFs • More work … but improves retrievals • And also avoids comparison errors Relation between retrieved column and true profile: Model column: In comparing retrieved and model columns, a priori profile errors cancel A M M
3. Take into account vertical sensitivity DOMINO v2 (w/ TM4 a priori profile shapes) average 2005 OMI NO2
3. Take into account vertical sensitivity DOMINO v2 (w/ GEOS-Chem a priori profile shapes) 2005 OMI NO2
3. Take into account vertical sensitivity GEOS-Chem (nested grid 0.5° × 0.67°) annual average 2005 GEOS-Chem NO2
3. Take into account vertical sensitivity Taking into account vertical sensitivity thus avoids this comparison error 10-40%
Representativity errors • Spatial coverage: 5 – 20% Inevitable & random • Model sampling: + 10 – 40% Avoidable & systematic • Vertical sensitivity: + 10 – 40% Avoidable & systematic • Total rep. errors: 5% random error (good scientist) • (+60% systematic error (…) ) • …and model process errors • NO2 satellite data are very useful in evaluating NOx emissions (trends, diurnal patterns, even location), but… • …for proper interpretation, model processes need to be evaluated carefully first (e.g. plume chemistry, diurnal cycle of emissions)
Sub-grid scale effects: ship emissions • Ship NOx emissions (including a discussion of the need to implement model improvements first … plume-in-grid) OMI NO2 columns (13:30 hrs)
First fix the model chemistry: here GEOS-Chem GEOS-Chem plume-in-grid approach for ship emissions Higher OH in early stages of the plume Improved simulations with plume-in-grid show 50% lower NOx concentrations than instant dilution! Vinken et al., ACP, 2011
Improved simulations with plume-in-grid show 50% lower NOx concentrations Shorter NOx lifetime More OH in first hours after emission GEOS-Chem Plume-in-grid vs. instant dilution