Download
1 / 16
160 likes | 260 Views
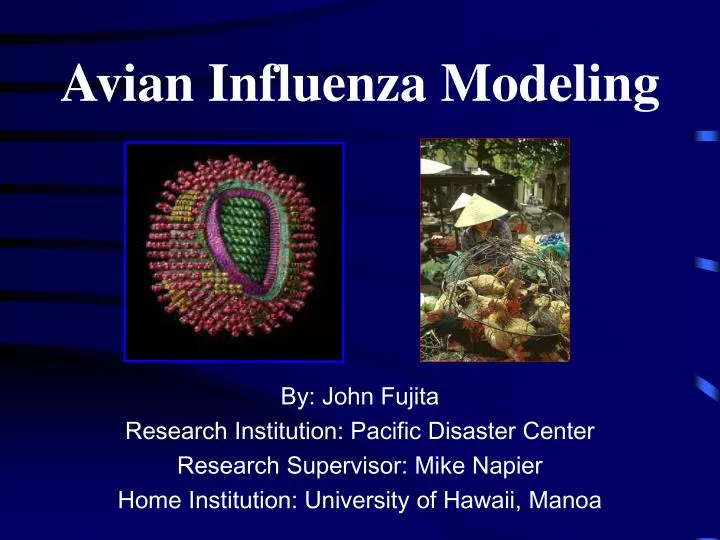
Avian Influenza Modeling. By: John Fujita Research Institution: Pacific Disaster Center Research Supervisor: Mike Napier Home Institution: University of Hawaii, Manoa. Background on Avian Influenza. Family orthomyxoviradae Relative of common flu Most prevalent in birds Spread

E N D
Avian Influenza Modeling By: John Fujita Research Institution: Pacific Disaster Center Research Supervisor: Mike Napier Home Institution: University of Hawaii, Manoa
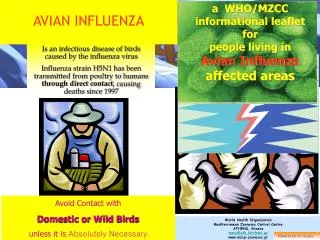
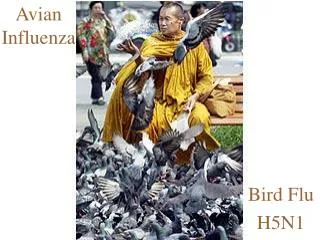
Background on Avian Influenza • Family orthomyxoviradae • Relative of common flu • Most prevalent in birds • Spread • Direct contact • Fecal matter • nasal and ocular discharges • Symptoms • Pneumonia, eye infections, pancreatic damage, and severe respiratory diseases
Economic Impact • 1983–1984outbreak of Highly Pathogenic AI in the USA • Destruction of more than 17 million birds • $63 million in Federal funds • additional $350 million in increased consumer costs
Historic Pandemics • 1918-1919 Spanish Flu • Worst Pandemic in History • 50 Million Deaths • Over 500,000 dead in US • 1957-1958 Asian Flu • 70,000 deaths in US • 1968-1969 Hong Kong Flu • 34,000 deaths in US
Potential Impact of a Pandemic • 20-50% of the world human population infected • 250 million deaths "We at WHO [the World Health Organization] believe that the world is now in the gravest possible danger of a pandemic…" Dr. Shigeru Omi, the WHO's Western Pacific Regional Director, 23 February 2005
Domestic birds Natural avian influenza cycle Pandemic disease cycle Shore birds Waterfowl Mammals (primarily swine) Humans Cycle of Avian Influenza Source from: www.doh.state.fl.us/Disease_ctrl/ epi/htopics/Avian_Influenza.ppt
Recent Breakouts • 108 confirmed human case studies • Infection clusters • First-time infection of multiple species • Death rate going down
My Contributions • Human case studies (at provincial level) • World Health Organization ~2004 • Animal case studies (at least district level) • OIE ~1997 • GIS data layers • Poultry and population density • Migratory bird flyways • Airline routes • Geospatial data • Rainfall, elevation, temperature, humidity, hydrology, wind direction
Conclusion • MORE FUNDING for PDC • Saving of millions of lives
Future of Project Develop knowledge base and gather raw data- John Fujita and Mike Napier Preliminary Model and Analysis – John Fujita and Mike Napier Develop contacts and obtain complete data – Allen Clark Complete Model and Analysis – Mike Napier Draw insightful conclusions- Mike Napier
Acknowledgements • Center for Adaptive Optics • Malika Bell • Lisa Hunter • Liz Espinoza • National Science Foundation • Maui Economic Development Board • Isla Yap • Leslie Willkins • Maui Community College • Mark Hoffman
BIG MAHOLOS • Pacific Disaster Center • Mike Napier • This project is supported by the National Science Foundation Science and Technology Center for Adaptive Optics, managed by the University of California at Santa Cruz under cooperative agreement No. AST - 9876783.