Download
1 / 1
10 likes | 102 Views
Relationships Between Land-Based Digital Imagery and Space-Based Satellite Imagery Calvin Diessner Adviser: Dr. Annette Schloss Institute for the Study of Earth, Oceans, and Space University of New Hampshire. Introduction

E N D
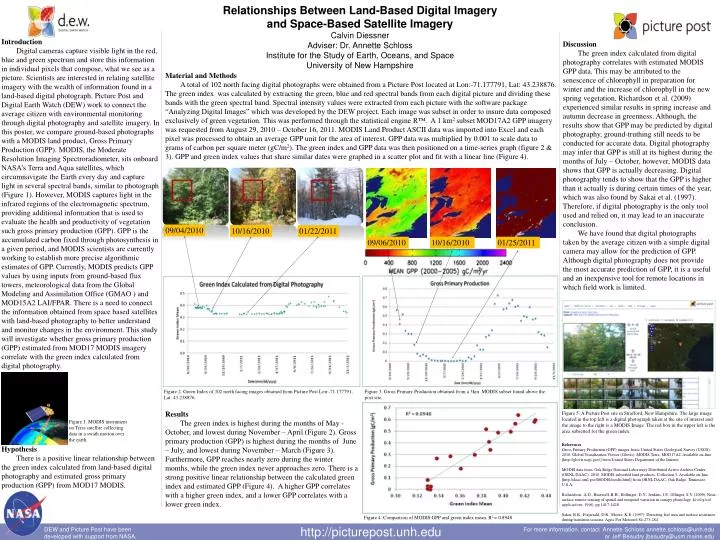
Relationships Between Land-Based Digital Imagery and Space-Based Satellite Imagery Calvin Diessner Adviser: Dr. Annette Schloss Institute for the Study of Earth, Oceans, and Space University of New Hampshire Introduction Digital cameras capture visible light in the red, blue and green spectrum and store this information in individual pixels that compose, what we see as a picture. Scientists are interested in relating satellite imagery with the wealth of information found in a land-based digital photograph. Picture Post and Digital Earth Watch (DEW) work to connect the average citizen with environmental monitoring through digital photography and satellite imagery. In this poster, we compare ground-based photographs with a MODIS land product, Gross Primary Production (GPP). MODIS, the Moderate Resolution Imaging Spectroradiometer, sits onboard NASA’s Terra and Aqua satellites, which circumnavigate the Earth every day and capture light in several spectral bands, similar to photograph (Figure 1). However, MODIS captures light in the infrared regions of the electromagnetic spectrum, providing additional information that is used to evaluate the health and productivity of vegetation such gross primary production (GPP). GPP is the accumulated carbon fixed through photosynthesis in a given period, and MODIS scientists are currently working to establish more precise algorithmic estimates of GPP. Currently, MODIS predicts GPP values by using inputs from ground-based flux towers, meteorological data from the Global Modeling and Assimilation Office (GMAO ) and MOD15A2 LAI/FPAR. There is a need to connect the information obtained from space based satellites with land-based photography to better understand and monitor changes in the environment. This study will investigate whether gross primary production (GPP) estimated from MOD17 MODIS imagery correlate with the green index calculated from digital photography. Discussion The green index calculated from digital photography correlates with estimated MODIS GPP data. This may be attributed to the senescence of chlorophyll in preparation for winter and the increase of chlorophyll in the new spring vegetation. Richardson et al. (2009) experienced similar results in spring increase and autumn decrease in greenness. Although, the results show that GPP may be predicted by digital photography, ground-truthing still needs to be conducted for accurate data. Digital photography may infer that GPP is still at its highest during the months of July – October, however, MODIS data shows that GPP is actually decreasing. Digital photography tends to show that the GPP is higher than it actually is during certain times of the year, which was also found by Sakai et al. (1997). Therefore, if digital photography is the only tool used and relied on, it may lead to an inaccurate conclusion. We have found that digital photographs taken by the average citizen with a simple digital camera may allow for the prediction of GPP. Although digital photography does not provide the most accurate prediction of GPP, it is a useful and an inexpensive tool for remote locations in which field work is limited. Material and Methods A total of 102 north facing digital photographs were obtained from a Picture Post located at Lon:-71.177791, Lat: 43.238876. The green index was calculated by extracting the green, blue and red spectral bands from each digital picture and dividing these bands with the green spectral band. Spectral intensity values were extracted from each picture with the software package “Analyzing Digital Images” which was developed by the DEW project. Each image was subset in order to insure data composed exclusively of green vegetation. This was performed through the statistical engine R™. A 1 km2 subsetMOD17A2 GPP imagery was requested from August 29, 2010 – October 16, 2011. MODIS Land Product ASCII data was imported into Excel and each pixel was processed to obtain an average GPP unit for the area of interest. GPP data was multiplied by 0.001 to scale data to grams of carbon per square meter (gC/m2). The green index and GPP data was then positioned on a time-series graph (figure 2 & 3). GPP and green index values that share similar dates were graphed in a scatter plot and fit with a linear line (Figure 4). 09/04/2010 10/16/2010 01/22/2011 09/06/2010 10/16/2010 01/25/2011 Figure 2. Green Index of 102 north facing images obtained from Picture Post Lon:-71.177791, Lat: 43.238876. Figure 3. Gross Primary Production obtained from a 3km MODIS subset found above the post site. Results The green index is highest during the months of May - October, and lowest during November – April (Figure 2). Gross primary production (GPP) is highest during the months of June – July, and lowest during November – March (Figure 3). Furthermore, GPP reaches nearly zero during the winter months, while the green index never approaches zero. There is a strong positive linear relationship between the calculated green index and estimated GPP (Figure 4). A higher GPP correlates with a higher green index, and a lower GPP correlates with a lower green index. Figure 5. A Picture Post site in Strafford, New Hampshire. The large image located in the top left is a digital photograph taken at the site of interest and the image to the right is a MODIS Image. The red box in the upper left is the area subsetted for the green index. Figure 1. MODIS instrument on Terra satellite collecting data in a swath motion over the earth. References Gross Primary Production (GPP) images from: United States Geological Survey (USGS). 2010. Global Visualization Viewer (Glovis). MODIS Terra, MOD17A2. Available on-line [http://glovis.usgs.gov/] from United States Department of the Interior MODIS data from: Oak Ridge National Laboratory Distributed Active Archive Center (ORNL DAAC). 2010. MODIS subsetted land products, Collection 5. Available on-line [http://daac.ornl.gov/MODIS/modis.html] from ORNL DAAC, Oak Ridge, Tennessee, U.S.A. Richardson, A.D., Braswell, B.H., Hollinger, D.Y., Jenkins, J.P., Ollinger, S.V. (2009). Near-surface remote sensing of spatial and temporal variation in canopy phenology. Ecological applications, 19(6), pp 1417-1428. Sakai, R.K., Fizjarrald, D.R., Moore, K.E. (1997). Detecting leaf area and surface resistance during transition seasons. Agric For Meteorol 84:273-284 Hypothesis There is a positive linear relationship between the green index calculated from land-based digital photography and estimated gross primary production (GPP) from MOD17 MODIS. Figure 4. Comparison of MODIS GPP and green index mean. R2 = 0.8948 http://picturepost.unh.edu DEW and Picture Post have been developed with support from NASA. For more information, contact Annette Schloss annette.schloss@unh.edu or Jeff Beaudryjbeaudry@usm.maine.edu