Download
1 / 14
140 likes | 320 Views
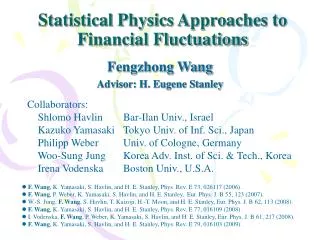
Statistical Physics Approaches to Financial Fluctuations. Collaborators: Philipp Weber, Woo-Sung Jung, Irena Vodenska, Kazuko Yamasaki and Shlomo Havlin. Fengzhong Wang Advisor: H. Eugene Stanley Dec 13, 2007. “Scaling and Memory of Intraday Volatility Return Intervals in Stock Markets”,

E N D
Statistical Physics Approaches to Financial Fluctuations Collaborators: Philipp Weber, Woo-Sung Jung, Irena Vodenska, Kazuko Yamasaki and Shlomo Havlin Fengzhong Wang Advisor: H. Eugene Stanley Dec 13, 2007 • “Scaling and Memory of Intraday Volatility Return Intervals in Stock Markets”, Phys. Rev. E 73, 026117 (2006). • “Statistical Regularities in the Return Intervals of Volatility”, Eur. Phys. J. B 55, 123 (2007).
Outline • Questions: • What are financial fluctuations? • Why we study? • Databases • Results: • Scaling • Memory • Long-term correlations • Take home message
What are financial fluctuations? Ex: Stock Price and Shares Traded Why study financial fluctuations? • Help understand markets and control risk
DAILY DATA U.S.A. Stocks, 1962-2007, total=107 records Foreign Exchange Rates, 1971-2007, total=105 records Crude Oil Futures, 1985-2007, total=104 records INTRADAY DATA Trades And Quotes: 2001-2002, every U.S.A. transactions, total=109 records 30 stocks: Dow Jones Industrial Average (DJIA), sampling interval=1 min, total=107 records S&P 500 Index: 1984-1996, total=105 records, sampling interval=10 min Databases Analyzed from Yahoo Finance; from Federal Reserve; from Energy Information Administration; from New York Stock Exchange.
How to Calculate Volatility? Step 1: Compute price change |log(p(t+1)/p(t))| Step 2: Remove intraday pattern by dividing A(s) Step 3: Normalize by standard deviation
Our Approach: Return Intervals qof Volatility Step 1: CHOOSE a threshold q Step 2: Calculate all time intervals between volatilities above q q=3 q=2
Result #2: Universality B) w.r.t. Stock Names A) w.r.t. Sampling Intervals
How to Analyze Memory? Divide return intervals into 8 subsets: S1, S2, …, S8 S8 Stock GE S1
How to Measure Long-Term Correlation?Method: Detrended Fluctuation Analysis d
Result #4: Detrended Fluctuation Analysis Surprise: Return interval correlations Volatility correlations
Take Home Message • Return intervals scale. • Scaling is universal for many markets and many time scales. • Return intervals show memory. • Scaling and memory are related to long-term correlations in volatility.