Download
1 / 21
330 likes | 1.09k Views
Metabolomics Applications to cancer research. Augustin SCALBERT Biomarkers Group. Metabolomics, the most downstrean biochemical dimension of biological systems. Indicator of both genetic and environmental conditions. Genome. Phenotype. Transcriptome. Environmental influence. Proteome.

E N D
MetabolomicsApplications to cancer research Augustin SCALBERT Biomarkers Group
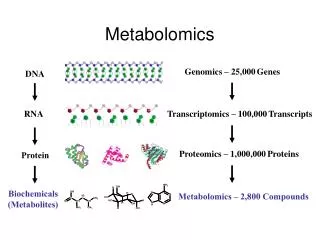
Metabolomics,the most downstrean biochemical dimension of biological systems • Indicator of both genetic and environmental conditions Genome Phenotype Transcriptome Environmental influence Proteome Metabolome
Metabolome and metabotypes • Interindividual distances by far larger than intraindividual distances • A model based on 15 urine fingerprints/per subject allows to predict with 100% confidence the donor of an unknown sample 22 men & women 40 urine samples/subject 1H-NMR Canonical analysis Assfalg et al., 2008, PNAS
Metabolomics in cancer research • A relatively recent field of research • Various applications • Mechanisms of carcinogenesis • Novel clinical biomarkers for cancer • Diagnosis, prognosis, recurrence • Discovery of novel risk factors for cancer • Diet, physical activity, contaminants, pollutants, occupational exposure
TIC 1.0 3.1 0 2.0 4.0 5.0 6.0 (min) Quercetin 301/151 Chlorogenic acid 353/191 Kaempferol 285/93 Caffeic acid 179/135 Hesperetin 301/164 m-Coumaric acid Naringenin 271/151 163/119 Phloretin Gallic acid 273/167 169/125 Isorhamnetin 315/300 4-O-Methylgallic acid 183/124 Enterodiol 301/253 Taxifolin Enterolactone 303/125 297/107 Two metabolomic approaches Untargeted metabolomics Targeted metabolomics Mass spectrometry 1H-NMR spectroscopy Biomarker discovery Biomarker quantification
Metabolome-Wide Association Studies (MWAS) NHANES cohorts (n=500-3300) 266 environmental factors in urine or plasma Fasting glucose Patel et al., 2010, Plos One Rappaport, 2012, Biomarkers
Aminoacid profiling and cancer diagnosis • Gln, Trp and His decreased in all cancers Miyagi et al., 2011, PLOS One
60 fatty acids and breast cancerin the EPIC-E3N cohort Nested case-control study in the E3N cohort 384 breast cancer cases / 768 controls 60 fatty acids by GC • 3 trans-fatty acids associated to breast cancer risk Trans fatty acid quintiles OR 95%CI 16:1 n-9 trans 1 1.00 3 1.17 0.74-1.83 P = 0.0016 5 2.24 1.30-3.86 18:1 n-9 trans 1 1.00 3 1.02 0.63-1.64 P = 0.12 5 1.45 0.90-2.33 16:1+18:1 n-9 trans 1 1.00 3 1.12 0.71-1.78 P = 0.018 5 1.75 1.08-2.83 1 2 Chajès et al, Am J Epidemiol 2008
186 endogenous metabolitesin blood, urine and biopsies • 10 uL plasma • 186 metabolites estimated • Acylcarnitines • Aminoacids • Biogenic amines • Hexoses • Phosphatidylcholines • Lysophosphatidylcholines • Sphingomyelins • 53 metabolites absolutely quantified (labelled standards) Biocrates kit IDQ p180
Isoleucine p=0.009 Leucine p=0.006 Valine p=0.012 Tyrosine p=0.034 Phenylalanine p=0.134 Metabotypes and type 2 diabetes risk Framingham Offspring Study 12 yrs follow-up 189 cases, 189 matched controls Plasma samples at baseline 61 metabolites by LC-ESI-MS-MS • 5 aminoacids predictors of T2DM risk • Branched chain aminoacids known to promote insulin resistance Adjusted odd ratios for developing diabetes Wang T.J. (2011) Nat. Med.
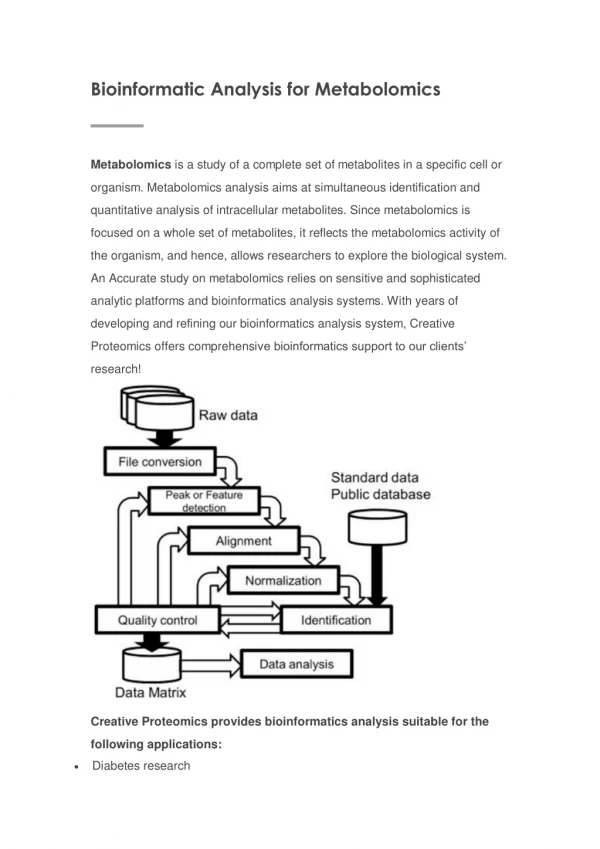
Controls N samples Cases N’ samples Blood, urine, tissue samples High resolution mass spectrometry Data preprocessing Multivariate statistics Characteristic signals Metabolite identification Biomarkers, biological understanding Untargeted metabolomics
Benign ovarian tumours Epithelial ovarian cancer Healthy Validation + glucuronide 685 women Different clinical backgrounds UPLC-ESI-MS Identification FT-ICR-MS 1 metabolite m/z 403 (ESI+) 27-nor-5β-cholestane-3,7,12,24,25 pentol glucuronide Benign Cancer Healthy Diagnosis of epithelial ovarian cancer Discovery 84 women Fasting sera (180 uL) UPLC-ESI-QTof OPLS-DA 13 discriminating variables (= 6 metabolites) Chen J. et al., 2011, J. Proteome Res.
Environment Diseases Biomarkers Genes Biomarkers of dietary exposure
Citrus biomarkers in the SU.VI.MAX2 cohort OSC-PLS (Log Pareto) SU.VI.MAX2 Cohort Food Frequency Questionnaires Low (<1.5 g/day) and high (>25 g/day) consumers Spot urine • 12 discriminating metabolites including proline betaine, hydroxyproline betaine, naringenin 7‐O glucuronide, hesperetin 3'‐O-glucuronide and 2 terpenoids Manach et al., submitted
Dietary biomarkers in the EPIC cohort EPIC Calibration Study n = 494 24-hr Urine samples collected on same day as 24HDR Diluted to same specific gravity UPLC-QTof (Agilent 6550) Negative ionization XCMS 24-hr Dietary recalls Food Frequency questionnaires Correlations with dietary intake
Dietary biomarkers in the EPIC cohort Catechin Protocatechuic acid sulphate Gallic acid ethyl ester glucuronide 3-O-Methylcatechin sulphate Dihydroresveratrol glucuronide 3,4-Dihydroxyphenylvalerolactone sulfate 3,4-Dihydroxyphenylvalerolactone glucuronide 3-O-Methyl-4-hydroxyphenylvalerolactone sulphate 3-O-Methylcatechin sulphate Epicatechin glucuronide sulfate Gallic acid 4-O-Methylgallic acid 4-O-Methylgallic acid sulfate Phloretin 2-O-glucuronide Hesperetin 3-O-glucuronide Hesperetin 3-O-sulfate Naringenin 4-O-glucuronide
Biomarkers for coffee consumption 24-hr Dietary recall Food Frequency Questionnaire
Agilent QTof 6550 AB Sciex QTrap 5500 Metabolomics and cancerConclusions • A powerful approach to discover new biomarkers for cancers • Diagnosis, prognosis • Biomarkers of exposure for cancer risk factors • MWAS to better understand cancer aetiology • Mechanisms of carcinogenesis • Identification of cancer risk factors • A new metabolomic platform at IARC • Mass spectrometry • Data analysis
DSQ Thermo Finnigan Agilent QTof 6550 AB Sciex QTrap 5500 IARC platform for metabolomics • Biomarker discovery • UPLC-ESI-QTof-MS • EWAS • UPLC-ESI-MS-MS • GC-MS and GC Augustin Scalbert Sabina Rinaldi Dinesh Barupal Veronique Chajes Will Edmands David Achaintre Beatrice Vozar Vanessa Neveu
Polyphenol metabolome • >500 polyphenols known in foods • No comprehensive method to analyse them in biospecimens • No labelled standards available • Differential isotopic labelling Collaboration Lian Li (Univ. of Alberta) Support from INCa (2012-2014) Urine standard Urine samples H313C 13CH3 Polyphenol Polyphenol