Download
1 / 53
550 likes | 730 Views
Past , Present, and Future Problems, Trends, and Solutions for the Most Important Lake in the World: Lake Erie. Dr. Jeffrey M. Reutter Director, Ohio Sea Grant College Program. Research Building. Stone Lab. Put-in-Bay, Ohio. Photo: Jeff Reutter . Great Lakes Land Use.

E N D
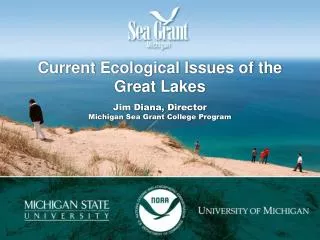
Past, Present, and Future Problems, Trends, and Solutions for the Most Important Lake in the World: Lake Erie Dr. Jeffrey M. Reutter Director, Ohio Sea Grant College Program
Research Building Stone Lab Put-in-Bay, Ohio Photo: Jeff Reutter
Great Lakes Land Use Image: Ohio Sea Grant
One of the Most Important Lakes in the World Dead lake image of 60s and 70s. Poster child for pollution problems in this country. But, most heavily utilized of any of the Great Lakes. Shared by 4 states and 2 countries. Best example of ecosystem recovery in world.
As a Result, Lake Erie Gets: More sediment More nutrients (fertilizers and sewage) More pesticides (The above 3 items are exacerbated by storms, which will be more frequent and severe due to global warming and climate change.) And is still biologically, the most productive of the Great Lakes
50:2 Rule (Not exact, but instructive) Lake Superior: 50% of the water and 2% of the fish Lake Erie: 2% of the water and 50% of the fish
80:10:10 Rule 80% of water from upper lakes 10% from Lake Erie tributaries 10% direct precipitation
Lake Erie Stats Drinking water for 11 million people Over 20 power plants 300 marinas in Ohio alone Walleye Capital of the World 40% of all Great Lakes charter boats Ohio’s charter boat industry in largest in North America $1.5 billion sport fishery One of top 10 sport fishing locations in the world The most valuable freshwater commercial fishery in the world
Historical Trends:The Lake Erie Ecosystem 1969—Cuyahoga River burns Getting worse annually to 1970 Stable 1970-75 Improving 1975-1995 1995+ Getting worse Photo: Ohio Sea Grant
Poster Child for Pollution Problems “I heard Lake Erie is the place fish go to die.” - Johnny Carson, 1976
Lake Erie’s Biggest Problems/Issues Sedimentation Phosphorus and nutrient loading Harmful algal blooms Aquatic invasive species Dead Zone Climate Change—Makes the others worse
Nutrients and Phosphorus Stone Lab September 11, 2011 Photo: Jeff Reutter
Why does Lake Erie get most nutrients? The most agriculture in its basin Few forests Wetlands gone Large human population—water treatment, septic tanks, sewage treatment (or lack thereof)
What brought about the rebirth? Phosphorus reductions from point sources (29,000 metric tons to 11,000);and agriculture helped!
Blue-green Algae Bloom circa 1970, Lake Erie Photo: Forsythe and Reutter
Why are we targeting phosphorus? Normally limiting nutrient in freshwater systems P reduction is best strategy ecologically and economically Reducing both P and N would help
Are we sure phosphorus reductions will solve the problem? It worked in the 70s and 80s and turned Lake Erie into the “Walleye Capital of the World” Approximately a 2/3 reduction in total P loading (29,000 tons to 11,000)
Impacts of Increased Phosphorus Concentrations • HABs—If P concentrations are high (regardless of the source, Ag, sewage, etc.) and water is warm, we will have a HAB (nitrogen concentration will likely determine which of the 6-7 species bloom) • Nuisance Algae Blooms • Cladophora—Whole lake problem. An attached form. • Dead Zone in Central Basin
Harmful Algal Blooms:Western Basin Problem Photo: Lake Erie Waterkeeper Inc
What are Harmful Algal Blooms and Why are We Concerned? 6-7 species of cyanobacteria (blue-green algae) Float Capable of producing 4 toxins, e.g., microcystin Require high levels of nutrients and warm water (above 60F) Some are nitrogen fixers Can cause human and animal illness and death
Microcystin Concentrations 1 ppb WHO drinking water limit 20 ppb WHO swimming limit 60 ppb highest level for Lake Erie till this year 84 ppb highest level for Grand Lake St. Marys till last year 2000+ Grand Lake St. Marys 2010 1200 Lake Erie Maumee Bay area 2011
Are HABs only a Lake Erie and Ohio Problem? Global problem Serious problem in US and Canada Common species in Lake Erie is Microcystis sp. Dominant form in Grand Lake St. Marysin 2010 was Aphanizomenon sp., the same species that bloomed in Lake Erie in the 60s and 70s
Detroit River Flow Maumee Bay Sandusky Bay Photo: NOAA Satellite Image
Maumee Bay, Ohio Photo: Ohio Department of Natural Resources
HAB Requirements Warm water (summer problem but now finding them in Maumee River as early as April) High phosphorus levels Zebra/quagga mussels (not required but remove competition)
Microcystis, Stone Lab, 8/10/10 Photos: Jeff Reutter
Maumee and Detroit Rivers Detroit and Maumee Rivers carry similar P loads But, Detroit is 80% of flow into Lake and Maumee is 3% Therefore, Maumee has much higher P concentrations P concentration is what allows algae to grow Detroit flow stays primarily on north shore Maumee flow stays primarily on south shore Western Basin flushout rate or residual time is 30-50 days--longer when flow is low and shorter when flow is high
Detroit River flow is clear and low in phosphorus August 11 2011 1330 cfs Photo: NOAA Satellite Image
Detroit River flow is clear and low in phosphorus August 16, 2011 Photo: NOAA Satellite Image
Stone Lab September 11, 2011 Photo: Jeff Reutter
Put-in-Bay Photo: Jeff Reutter
October 9, 2011 Photo: NOAA Satellite Image
Microcystis near Marblehead October 9, 2011 Photo: Richard Kraus, United States Geological Survey
HABs:Western Basin Problembut Contribute to Oxygen Demand inthe Central Basin, i.e.the Dead Zone
Lake Erie Cross Section Image: Ohio Sea Grant
Grand Lake St. Marys July, 2010 Photo: Ohio EPA
Lake Erie Millennium Network Synthesis Team • Interdisciplinary discussions were very valuable and beneficial to the report and individual team members. • Should try to keep the team together to address identified research needs and to aid managers in developing strategies to address the problem. • Jeff Reutter • Jan Ciborowski • Steve Davis • Joe DePinto • Darren Bade • David Baker • Tom Bridgeman • David Culver • Elizabeth Dayton • Doug Kane • Jack Kramer • Robert Mullen • Christopher Pennuto
Final Report: June 14, 2011 • Preliminary presentations for managers: February 10, 2010 and March 28, 2011 • 9 hours of conference calls since end of March • 10 pages of summary, findings, and implications • 23 Findings • 28 Implications • 18 research recommendations • An appendix with some items needing additional discussion
Possible Agriculture Action Areas Incorporate P into soil Prevent applications above agronomic needs Reduce fall application Eliminate application of P on frozen or snow covered ground Get soil tests for all fields
What other levers can we turn? • Eliminate open lake disposal of harbor dredgings from Maumee River • Eliminate orthophosphorus additions at water treatment plants • Reduce sewage treatment plant P limits • Improve septic systems • Eliminate CSOs
Zebra Mussel vsQuagga Mussel Photo: Ohio Sea Grant
Walleye mean # per hectare 1995 2000 2005 2011 1990