Download
1 / 48

E N D
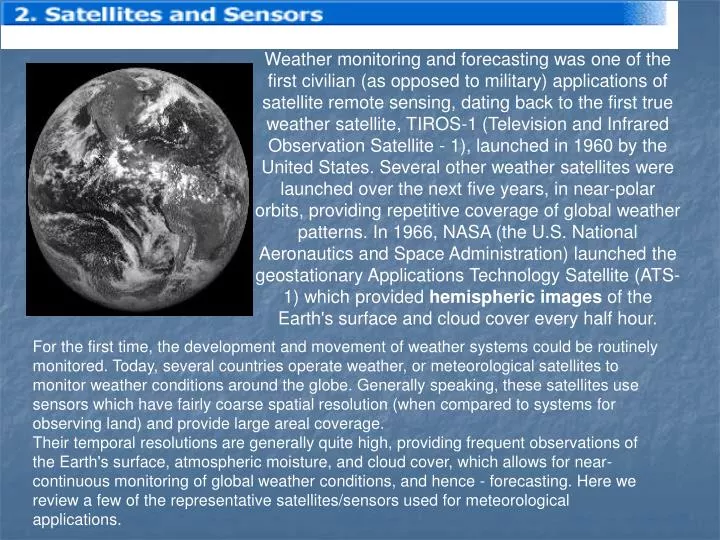
Weather monitoring and forecasting was one of the first civilian (as opposed to military) applications of satellite remote sensing, dating back to the first true weather satellite, TIROS-1 (Television and Infrared Observation Satellite - 1), launched in 1960 by the United States. Several other weather satellites were launched over the next five years, in near-polar orbits, providing repetitive coverage of global weather patterns. In 1966, NASA (the U.S. National Aeronautics and Space Administration) launched the geostationary Applications Technology Satellite (ATS-1) which provided hemispheric images of the Earth's surface and cloud cover every half hour. For the first time, the development and movement of weather systems could be routinely monitored. Today, several countries operate weather, or meteorological satellites to monitor weather conditions around the globe. Generally speaking, these satellites use sensors which have fairly coarse spatial resolution (when compared to systems for observing land) and provide large areal coverage. Their temporal resolutions are generally quite high, providing frequent observations of the Earth's surface, atmospheric moisture, and cloud cover, which allows for near-continuous monitoring of global weather conditions, and hence - forecasting. Here we review a few of the representative satellites/sensors used for meteorological applications.
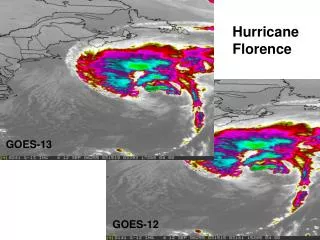
GOES The GOES (Geostationary Operational Environmental Satellite) System is the follow-up to the ATS series. They were designed by NASA for the National Oceanic and Atmospheric Administration (NOAA) to provide the United States National Weather Service with frequent, small-scale imaging of the Earth's surface and cloud cover. The GOES series of satellites have been used extensively by meteorologists for weather monitoring and forecasting for over 20 years. These satellites are part of a global network of meteorological satellites spaced at approximately 70° longitude intervals around the Earth in order to provide near-global coverage. Two GOES satellites, placed in geostationary orbits 36000 km above the equator, each view approximately one-third of the Earth. One is situated at 75°W longitude and monitors North and South America and most of the Atlantic Ocean. The other is situated at 135°W longitude and monitors North America and the Pacific Ocean basin.
Together they cover from 20°W to 165°E longitude. This GOES image covers a portion of the southeastern United States, and the adjacent ocean areas where many severe storms originate and develop. This image shows Hurricane approaching the southeastern United States and the Bahamas in September of 1996. Two generations of GOES satellites have been launched, each measuring emitted and reflected radiation from which atmospheric temperature, winds, moisture, and cloud cover can be derived. The first generation of satellites consisted of GOES-1 (launched 1975) through GOES-7 (launched 1992). GOES-8 and the other second generation GOES satellites have separate imaging and sounding instruments. The imager has five channels sensing visible and infrared reflected and emitted solar radiation. The infrared capability allows for day and night imaging.
GOES Bands GOES Bands
NOAA AVHRR NOAA is also responsible for another series of satellites which are useful for meteorological, as well as other, applications. These satellites, in sun-synchronous, near-polar orbits (830-870 km above the Earth), are part of the Advanced TIROS series (originally dating back to 1960) and provide complementary information to the geostationary meteorological satellites (such as GOES). Two satellites, each providing global coverage, work together to ensure that data for any region of the Earth is no more than six hours old. One satellite crosses the equator in the early morning from north-to-south while the other crosses in the afternoon. The primary sensor on board the NOAA satellites, used for both meteorology and small-scale Earth observation is the Advanced Very High Resolution Radiometer (AVHRR). The AVHRR sensor detects radiation in the visible, near and mid infrared, and thermal infrared portions of the electromagnetic spectrum, over a swath width of 3000 km.
Other Weather Satellites There are several other meteorological satellites in orbit, launched and operated by other countries, or groups of countries. These include Japan, with the GMS satellite series, and the consortium of European communities, with the METEOSAT satellites. Both are geostationary satellites situated above the equator over Japan and Europe, respectively.
TOVS(TIROS-N OPER. VERT. SOUNDER BY NOAA) There are 3 observation systems • IRS(high resolution Infrared radiation sounder) • MSU(microwave sounding unit) • SSU(microwave sounding unit)
Land Observation Satellites/Sensors Landsat-1, was launched by NASA in 1972. Initially referred to as ERTS-1, (Earth Resources Technology Satellite), Landsat was designed as an experiment to test the feasibility of collecting multi-spectral Earth observation data All Landsat satellites are placed in near-polar, sun-synchronous orbits. The first three satellites (Landsats 1-3) are at altitudes around 900 km and have revisit periods of 18 days while the later satellites are at around 700 km and have revisit periods of 16 days.
A number of sensors have been on board the Landsat series of satellites, including the Return Beam Vidicon (RBV) camera systems, the MultiSpectral Scanner (MSS) systems, and the Thematic Mapper (TM). The most popular instrument in the early days of Landsat was the MultiSpectral Scanner (MSS) and later the Thematic Mapper (TM). Each of these sensors collected data over a swath width of 185 km, with a full scene being defined as 185 km x 185 km. MSS Bands
(Système Pour l'Observation de la Terre) is a series of Earth observation imaging satellites designed and launched by CNES (Centre National d'Études Spatiales) of France, with support from Sweden and Belgium. SPOT The Indian Remote Sensing (IRS) satellite series, combines features from both the Landsat MSS/TM sensors and the SPOT HRV sensor. IRS The first is the MEIS-II (Multispectral Electro-optical Imaging Scanner) sensor developed for the Canada Centre for Remote Sensing. The Compact Airborne Spectrographic Imager, is a leader in airborne imaging, being the first commercial imaging spectrometer. CASI
Marine Observation Satellites/Sensors The Nimbus-7 satellite, launched in 1978, carried the first sensor, the Coastal Zone Colour Scanner (CZCS), specifically intended for monitoring the Earth's oceans and water bodies. The primary objective of this sensor was to observe ocean colour and temperature, particularly in coastal zones, with sufficient spatial and spectral resolution to detect pollutants in the upper levels of the ocean and to determine the nature of materials suspended in the water column. The first Marine Observation Satellite (MOS-1) was launched by Japan in February, 1987 and was followed by its successor, MOS-1b, in February of 1990. These satellites carry three different sensors: a four-channel Multispectral Electronic Self-Scanning Radiometer (MESSR), a four-channel Visible and Thermal Infrared Radiometer (VTIR), and a two-channel Microwave Scanning Radiometer (MSR), in the microwave portion of the spectrum. MOS
They are used for very specific detection and monitoring of various ocean phenomena including: ocean primary production and phytoplankton processes, ocean influences on climate processes (heat storage and aerosol formation), and monitoring of the cycles of carbon, sulfur, and nitrogen. SeaWiFS (Sea-viewing Wide-Field-of View Sensor) FLIR Typically positioned on aircraft or helicopters, and imaging the area ahead of the platform, FLIR systems provide relatively high spatial resolution imaging that can be used for military applications, search and rescue operations, law enforcement, and forest fire monitoring. Forward Looking InfraRed systems An active imaging technology very similar to RADAR. Lidar is also used in atmospheric studies to examine the particle content of various layers of the Earth´s atmosphere and acquire air density readings and monitor air currents. Lidar LIght Detection And Ranging
RADAR systems are active sensors which provide their own source of electromagnetic energy. RADAR Because RADAR provides its own energy source, images can be acquired day or night. RAdio Detection And Ranging Also, microwave energy is able to penetrate through clouds and most rain, making it an all-weather sensor.
Data Reception, Transmission, and Processing There are three main options for transmitting data acquired by satellites to the surface. The data can be directly transmitted to Earth if a Ground Receiving Station (GRS) is in the line of sight of the satellite (A). the data can be recorded on board the satellite directly (B) for transmission to a GRS at a later time. Data can also be relayed to the GRS through the Tracking and Data Relay Satellite System (TDRSS) (C), which consists of a series of communications satellites in geosynchronous orbit. The data are transmitted from one satellite to another until they reach the appropriate GRS.
For many sensors it is possible to provide customers with quick-turnaround imagery when they need data as quickly as possible after it is collected. Near real-time processing systems are used to produce low resolution imagery in hard copy or soft copy (digital) format within hours of data acquisition. Such imagery can then be faxed or transmitted digitally to end users.
Microwave sensing encompasses both active and passive forms of remote sensing the microwave portion of the spectrum covers the range from approximately 1cm to 1m in wavelength Longer wavelength microwave radiation can penetrate through cloud cover, haze, dust, and all but the heaviest rainfall
A passive microwave sensor detects the naturally emitted microwave energy within its field of view. This emitted energy is related to the temperature and moisture properties of the emitting object or surface. Passive microwave sensors are typically radiometers or scanners The microwave energy recorded by a passive sensor can be emitted by the atmosphere (1), reflected from the surface (2), emitted from the surface (3), or transmitted from the subsurface (4).
meteorologists can use passive microwaves to measure atmospheric profiles and to determine water and ozone content in the atmosphere Applications of passive microwave remote sensing include meteorology, hydrology, and oceanography. Oceanographic applications include mapping sea ice, currents, and surface winds as well as detection of pollutants Hydrologists use passive microwaves to measure soil moisture since microwave emission is influenced by moisture content.
Active microwave sensors provide their own source of microwave radiation to illuminate the target. Active microwave sensors are generally divided into two distinct categories: imaging and non-imaging. The most common form of imaging active microwave sensors is RADAR. The radar’s sensor transmits a microwave (radio) signal towards the target and detects the backscattered portion of the signal.
The strength of the backscattered signal is measured to discriminate between different targets and the time delay between the transmitted and reflected signals determines the distance (or range) to the target. Non-imaging microwave sensors include altimeters and scatterometers. Radar altimeters transmit short microwave pulses and measure the round trip time delay to targets to determine their distance from the sensor. Scatterometers are also generally non-imaging sensors and are used to make precise quantitative measurements of the amount of energy backscattered from targets.
Scatterometry measurements over ocean surfaces can be used to estimate wind speeds based on the sea surface roughness. Ground-based scatterometers are used extensively to accurately measure the backscatter from various targets in order to characterize different materials and surface types. This is analogous to the concept of spectral reflectance curves in the optical spectrum.
As with passive microwave sensing, a major advantage of radar is the capability of the radiation to penetrate through cloud cover and most weather conditions. Because radar is an active sensor, it can also be used to image the surface at any time, day or night. These are the two primary advantages of radar: all-weather and day or night imaging.
Radar Basics a radar is essentially a ranging or distance measuring device It consists fundamentally of a transmitter, a receiver, an antenna, and an electronics system to process and record the data. The transmitter generates successive short bursts (or pulses of microwave (A) at regular intervals which are focused by the antenna into a beam (B). The antenna receives a portion of the transmitted energy reflected (or backscattered) from various objects within the illuminated beam (C)
the polarization of the radiation is also important. Polarization refers to the orientation of the electric field Most radars are designed to transmit microwave radiation either horizontally polarized (H) or vertically polarized (V). HH - for horizontal transmit and horizontal receive, VV - for vertical transmit and vertical receive, HV - for horizontal transmit and vertical receive, and VH - for vertical transmit and horizontal receive.
Airborne and Spaceborne Radar Systems Convair-580 C/X SAR system AirSAR system JERS-1 Sea Ice and Terrain Assessment (STAR) ERS-1 SEASAT
Targets may be a point, line, or area feature. This means that they can have any form, from a bus in a parking lot or plane on a runway, to a bridge or roadway, to a large expanse of water or a field. In order to take advantage of and make good use of remote sensing data, we must be able to extract meaningful information from the imagery. This brings us to the topic of discussion in this chapter - interpretation and analysis Interpretation and analysis of remote sensing imagery involves the identification and/or measurement of various targets in an image in order to extract useful information about them. Targets in remote sensing images may be any feature or object which can be observed in an image, and have the following characteristics:
Targets may be a point, line, or area feature. This means that they can have any form, from a bus in a parking lot or plane on a runway, to a bridge or roadway, to a large expanse of water or a field. The target must be distinguishable; it must contrast with other features around it in the image.
Much interpretation and identification of targets in remote sensing imagery is performed manually or visually, i.e. by a human interpreter. In many cases this is done using imagery displayed in a pictorial or photograph-type format, independent of what type of sensor was used to collect the data and how the data were collected. In this case we refer to the data as being in analog format. remote sensing images can also be represented in a computer as arrays of pixels, with each pixel corresponding to a digital number, representing the brightness level of that pixel in the image
In this case, the data are in a digital format. Visual interpretation may also be performed by examining digital imagery displayed on a computer screen. Both analogue and digital imagery can be displayed as black and white (also called monochrome) images, or as colour images by combining different channels or bands representing different wavelengths. When remote sensing data are available in digital format, digital processing and analysis may be performed using a computer. Digital processing may be used to enhance data as a prelude to visual interpretation. Digital processing and analysis may also be carried out to automatically identify targets and extract information completely without manual intervention by a human interpreter. However, rarely is digital processing and analysis carried out as a complete replacement for manual interpretation. Often, it is done to supplement and assist the human analyst.
Manual interpretation and analysis dates back to the early beginnings of remote sensing for air photo interpretation. Digital processing and analysis is more recent with the advent of digital recording of remote sensing data and the development of computers. Both manual and digital techniques for interpretation of remote sensing data have their respective advantages and disadvantages. Generally, manual interpretation requires little, if any, specialized equipment, while digital analysis requires specialized, and often expensive, equipment. Manual interpretation is often limited to analyzing only a single channel of data or a single image at a time due to the difficulty in performing visual interpretation with multiple images. The computer environment is more amenable to handling complex images of several or many channels or from several dates. In this sense, digital analysis is useful for simultaneous analysis of many spectral bands and can process large data sets much faster than a human interpreter.
Manual interpretation is a subjective process, meaning that the results will vary with different interpreters. Digital analysis is based on the manipulation of digital numbers in a computer and is thus more objective, generally resulting in more consistent results. However, determining the validity and accuracy of the results from digital processing can be difficult. It is important to reiterate that visual and digital analyses of remote sensing imagery are not mutually exclusive. Both methods have their merits. In most cases, a mix of both methods is usually employed when analyzing imagery. In fact, the ultimate decision of the utility and relevance of the information extracted at the end of the analysis process, still must be made by humans.
Recognizing targets is the key to interpretation and information extraction. Observing the differences between targets and their backgrounds involves comparing different targets based on any, or all, of the visual elements of tone, shape, size, pattern, texture, shadow, and association. Tone refers to the relative brightness or colour of objects in an image. Generally, tone is the fundamental element for distinguishing between different targets or features. Variations in tone also allows the elements of shape, texture, and pattern of objects to be distinguished.
Shape refers to the general form, structure, or outline of individual objects. Shape can be a very distinctive clue for interpretation. Straight edge shapes typically represent urban or agricultural (field) targets, while natural features, such as forest edges, are generally more irregular in shape, except where man has created a road or clear cuts. Farm or crop land irrigated by rotating sprinkler systems would appear as circular shapes.
Size of objects in an image is a function of scale. It is important to assess the size of a target relative to other objects in a scene, as well as the absolute size, to aid in the interpretation of that target. A quick approximation of target size can direct interpretation to an appropriate result more quickly. For example, if an interpreter had to distinguish zones of land use, and had identified an area with a number of buildings in it, large buildings such as factories or warehouses would suggest commercial property, whereas small buildings would indicate residential use.
Patternrefers to the spatial arrangement of visibly discernible objects. Typically an orderly repetition of similar tones and textures will produce a distinctive and ultimately recognizable pattern. Orchards with evenly spaced trees, and urban streets with regularly spaced houses are good examples of pattern.
Texture refers to the arrangement and frequency of tonal variation in particular areas of an image. Rough textures would consist of a mottled tone where the grey levels change abruptly in a small area, whereas smooth textures would have very little tonal variation. Smooth textures are most often the result of uniform, even surfaces, such as fields, asphalt, or grasslands. A target with a rough surface and irregular structure, such as a forest canopy, results in a rough textured appearance. Texture is one of the most important elements for distinguishing features in radar imagery.
Shadow is also helpful in interpretation as it may provide an idea of the profile and relative height of a target or targets which may make identification easier. However, shadows can also reduce or eliminate interpretation in their area of influence, since targets within shadows are much less (or not at all) discernible from their surroundings. Shadow is also useful for enhancing or identifying topography and landforms, particularly in radar imagery.
Associationtakes into account the relationship between other recognizable objects or features in proximity to the target of interest. The identification of features that one would expect to associate with other features may provide information to facilitate identification. In the example, commercial properties may be associated with proximity to major transportation routes, whereas residential areas would be associated with schools, playgrounds, and sports fields. In our example, a lake is associated with boats, a marina, and adjacent recreational land.
Digital Image Processing In today's world of advanced technology where most remote sensing data are recorded in digital format, virtually all image interpretation and analysis involves some element of digital processing. Digital image processing may involve numerous procedures including formatting and correcting of the data, digital enhancement to facilitate better visual interpretation, or even automated classification of targets and features entirely by computer. In order to process remote sensing imagery digitally, the data must be recorded and available in a digital form suitable for storage on a computer tape or disk. Obviously, the other requirement for digital image processing is a computer system, sometimes referred to as an image analysis system, with the appropriate hardware and software to process the data. Several commercially available software systems have been developed specifically for remote sensing image processing and analysis.
For discussion purposes, most of the common image processing functions available in image analysis systems can be categorized into the following four categories: Preprocessing Image Enhancement Image Transformation Image Classification and Analysis Preprocessing functions involve those operations that are normally required prior to the main data analysis and extraction of information, and are generally grouped as radiometric or geometric corrections.
Radiometric corrections include correcting the data for sensor irregularities and unwanted sensor or atmospheric noise, and converting the data so they accurately represent the reflected or emitted radiation measured by the sensor. Geometric corrections include correcting for geometric distortions due to sensor-Earth geometry variations, and conversion of the data to real world coordinates (e.g. latitude and longitude) on the Earth's surface.
The objective of the second group of image processing functions grouped under the term of image enhancement, is solely to improve the appearance of the imagery to assist in visual interpretation and analysis. Examples of enhancement functions include contrast stretching to increase the tonal distinction between various features in a scene, and spatial filtering to enhance (or suppress) specific spatial patterns in an image.
Image transformations are operations similar in concept to those for image enhancement. However, unlike image enhancement operations which are normally applied only to a single channel of data at a time, image transformations usually involve combined processing of data from multiple spectral bands. Arithmetic operations (i.e. subtraction, addition, multiplication, division) are performed to combine and transform the original bands into "new" images which better display or highlight certain features in the scene. We will look at some of these operations including various methods of spectral or band ratioing, and a procedure called principal components analysis which is used to more efficiently represent the information in multichannel imagery.
Image classification and analysis operations are used to digitally identify and classify pixels in the data. Classification is usually performed on multi-channel data sets (A) and this process assigns each pixel in an image to a particular class or theme (B) based on statistical characteristics of the pixel brightness values. There are a variety of approaches taken to perform digital classification. We will briefly describe the two generic approaches which are used most often, namely supervised and unsupervised classification.
Some project titles • Pre-processing in image analysis of satellite pictures • Image Enhancement and Image Transformations in remote sensing • Image Classification, Data Integration and Analysis • Multispectral Scanning and Thermal Imaging of satellites • Radiometric, spectral and temporal resolutions in remote sensing • Remote sensing applications for Agriculture • Remote sensing applications for Hydrology • Remote sensing applications for Geology • Remote sensing applications for Oceans and Coastal • Advanced radar applications in Meteorology