Download
1 / 34
340 likes | 467 Views
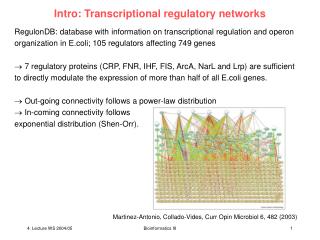
Microarrays to Functional Genomics: Generation of Transcriptional Networks from Microarray experiments . Joshua Stender December 3, 2002 Department of Biochemistry. What is a genetic network?.

E N D
Microarrays to Functional Genomics:Generation of Transcriptional Networks from Microarray experiments Joshua Stender December 3, 2002 Department of Biochemistry
What is a genetic network? Gene networks are usually represented as directed graphs where the nodes are defined as the genes and the edges represent regulation. Networks summarized a limited relationship between a subset of genes in both positive and negative feedback loops. Jenssen et al. 2001
Why interested in Genetic Networks? • Drug therapies for complex diseases • Gain insights for stimulus-response interactions • Identify novel pathways • Understand cell physiology • Understand multifactor gene-gene or gene-protein relationships in normal and disease states
Modeling Network Framework • Need to define a map from sequence space to functional space • Stage of Regulation (RNA, Protein) • Temporal Regulation • Spatial Regulation(Nucleus,Cytoplasm, etc)
Prazhnik et al. Gene networks:how to put the function in genomics. Trends in Biochem 20: 467-72.
Methods for Developing Gene Networks • Two types of experiments used for network design: Time series and Steady-State gene knock-out • Co-expression clustering • Cis acting elements in promoters(Amy Creekmore) • Reverse Engineering: use of algorithms to generate new networks
Time-Series Approach • Expression level of a certain gene at a time point can be modeled as some function of previous time points. • Problem exists with dimensionality where more genes then time points. Better results require more time points • Solution in the literature: Basic Linear Model, Singular Value Decomposition, and Bayesian Networks
Steady-State Approach • Takes advantage of gene deletions or over expression • If gene A goes up after gene B deleted, perhaps gene B is negative modulator of A and so on • Microarrays offer opportunities to identify gene deletion consequences on entire genomes
Genetic Network Generation Schematic Jong Modeling and simulation of genetic regulatory systems: a literature review. J. Comput Biol 2002;9(1):67-103
Algorithmic Approach to Network Design • Boolean Binary State along with co expression clustering • Continuous Steady-State(Non-Linear):Assumes genes can have intermediate states • Singular Value Decomposition
Methods for Generating Gene Networks • D’Haeseleer et al. Genetic network inference: from co-expression clustering to reverse engineering. Bioinformatics 16(8): 707-26. • Fuente et al. Linking the genes: inferring quantitative gene networks from microarray data. Trends in Genetics 18(8): 395-98. • Toh et al. Inference of a genetic network by a combined approach of cluster analysis and graphical Gaussian modeling. Bioinformatics 18(2): 287-297.
Types of Clustering • Non-hierarchical- clusters N objects into K Groups until a preset threshold is established. Examples include: K-means, SOM, and Expectation-maximization • Hierarchical- returns a hierarchy of nested clusters (agglomerative vs. divisive)
Why use clustering? • Wealth of data from microarray is overwhelming • Cluster to limit gene list to one that has genes that change significantly • Inference of functional annotation • Extraction of regulatory motifs • Molecular signature for distinguishing cell or tissue types • Use of learning machines to characterize unknown genes
Determining Distances Between Genes • Majority of clustering algorithms use matrix of pair wise distances between genes • Distances can be calculated based on: • Similarity according to positive correlations • Similarity based on positive and negative correlations • Similarity based on mutual information
Guilt-by Association(GBA) • Gene selected at random and determine its nearest neighbor • Genes are clustered based on arbitrary cut-off distances in expression space • Assumes that genes regulated in the same pattern participate in similar processes
K-means Clustering • Partitions N genes into K groups • Centroids are weighted center of a cluster • Each gene is assigned to a cluster and the centroid is calculated • Centroid continuously recalculated and genes reassigned
Self-Organizing Maps (SOM) • Very similar to K-means, however cluster centers are placed on a grid • At each iteration, gene pattern chosen at random and nearest cluster neighbor and cluster center updated • Requires user to define number cluster and grid size
Expectation-Maximization • Clustering similar to K-means, however genes assigned to multiple categories • Membership to a cluster is based on Gaussian distribution of probabilities • Continuously update membership and the 3 following parameters are assigned for each cluster: centroid, covariance, and mixture weight
Determining which clustering analysis to use • Each combination of distance measure and clustering algorithm will emphasize different types of regularities associated with data • Best to complement data with more than one clustering analysis due to variety of algorithms and the multiple functions of each gene
Construction of a Simple Network Clustering Brazhnik et al.
Boolean Networks • Simplification: each gene represented in the binary ON/Off state • Each gene is regulated by other genes using Boolean functions • Most genes are in an intermediate state and therefore are continuous
Example of a Boolean Network Jong Modeling and simulation of genetic regulatory systems: a literature review. J. Comput Biol 2002;9(1):67-103
Limitations of Boolean Networks • Fail to reveal causality • Non-Quantitative • Does not take into account multiple gene states • In the future Protein-Protein interaction maps need to be included
Graphical Gaussian Model • Toh et al. Inference of a Genetic Network by a Combined Approach of Cluster Analysis and Graphical Gaussian Modeling. Bioinformatics 18(2): 287-297. • Goal: To establish a method to combine Clustering and GGM for genetic network predictions.
Graphical Gaussian Modeling • GGM is a multivariate analysis to infer or test a statistical model for the relationship among a plural of variables where a partial correlation is used • Data: 2467 Saccharomyces cerevisiae genes under 79 different conditions
Graphical Gaussian Method • Genes were clustered into 34 distinct clusters • To reduce dimensionality, each cluster was averaged for each condition
Stepwise iterative algorithm developed by Wermuth and Scheidht(1977) Step 0: Complete Graph generated with M nodes and every node connected to each other. Step 1: Calculate partial correlation Matrix P(t) from correlated Coefficient Matrix C(t) where t indicates iteration. Step 2: Find element with smallest absolute value in P(t) and replace it with 0. Step 3: Reconstruct C(t+1) from P(t) Step 4: Termination is dependent on deviance Dev1= Nlog ( | C(t+1) |/|C(0)|) Dev2= Nlog ( | C(t+1) |/|C(t)|) Calculate dev1 and dev2. If either dev <.05 iteration stopped. Else go to step1
Graphical Gaussian Method Sub graph of the independence graph corresponding to partial correlation coefficient matrix
Graphical Gaussian Method Results and conclusions • Algorithm stopped after 189 iterations • SUC2(sucrose hydrolyzing enzyme) was used as model to evaluate accuracy of method: Among 40 known correlations for other genes, method identified 3 to be of same cluster,8 to have correlation of 0 and 29 to interact. • Conclude that about 75% accurate. • Could be a highly effective method for gene network generation if combined with previous knowledge
Linear Additive Method • Fuente et al. “Linking the genes: inferring quantitative gene networks from microarray data.” Trends in Genetics 18(8): 395-8. • Goal: To establish a method for inferring gene networks and the corresponding gene interaction strengths • Represent gene networks that consider expression levels as continuous variables
Linear Additive Method Co-control coefficient FR=Fluorescence Intensities
Linear Additive Method Conclusions • In Silico approach is useful in testing inferred networks • Can be used with experiments with one gene disruption at a time • Generated method for developing gene networks that include quantitative interaction strengths
New and Improved Network Designs • Continuous-value network inference: uses differential equations and allows genes to be continuous variables • Gene Duplication: Network nodes are randomly duplicated to help network connections evolve • Many computer simulations are being developed to help mimic real data to aid in the design of new algorithms
Conclusion and Outlook • Integration of large amount of biological data and computational power increasing our knowledge of complex systems • Increasing need to standardize microarray experiments and create databases • Gradual improvement of cluster and gene inference algorithms • Addition of differential proteomics and also incorporation of multiple regulation steps