Download
1 / 70
700 likes | 852 Views
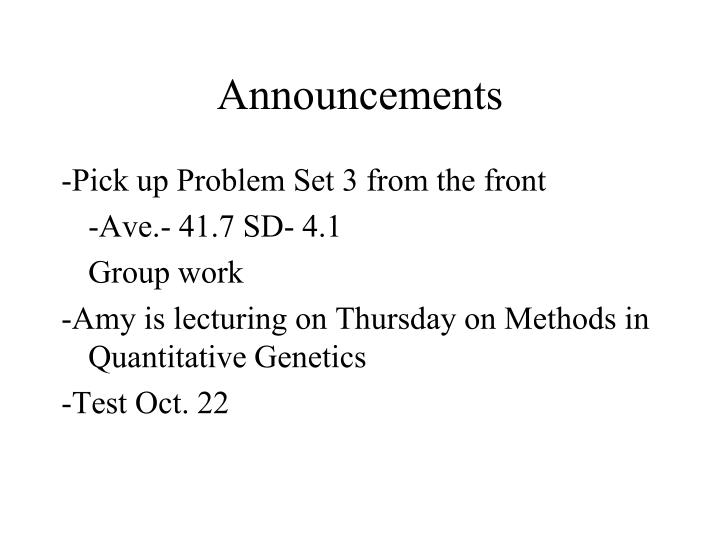
Announcements. -Pick up Problem Set 3 from the front -Ave.- 41.7 SD- 4.1 Group work -Amy is lecturing on Thursday on Methods in Quantitative Genetics -Test Oct. 22. Introduction to Quantitative Genetics 10/6/09. Quantitative Genetics is the statistic relationship between

E N D
Announcements -Pick up Problem Set 3 from the front -Ave.- 41.7 SD- 4.1 Group work -Amy is lecturing on Thursday on Methods in Quantitative Genetics -Test Oct. 22
Introduction to Quantitative Genetics10/6/09 Quantitative Genetics is the statistic relationship between genotype and phenotype. It does not concern itself with the mechanistic theory of how genotype (interacting with environment) produces phenotype (developmental genetics). Only statistical relationships are important, because evolution can only act on genotypes that are associated with particular phenotypes. Population parameters such as allele frequency and mating factors can strongly effect these statistical associations!
Physical Basis of Evolution • DNA can replicate • DNA can mutate and recombine • DNA encodes information that interacts with the environment to influence phenotype
Goal of Today • Derive a measure to describe the phenotype that each individual gamete contributes on to the next generation relative to the average phenotype. • Two of these measures (Average Excess and Average Effect)
Mendelism After 1908 • Hardy-Weinberg Helped Establish That Many Traits Were Mendelian • Still, the Majority of Quantitative Traits Could Not Be Put Into A Mendelian Framework • Most Traits Were Quantitative • Therefore, Many Believed That An Alternative and More Important Mechanism of Heredity Existed in Addition to Mendelism
Ronald A. Fisher • By Age 22 (1912) was laying the basis for much of modern statistics, but could not get an academic position • In 1913 Became Convinced of Mendelism • In 1916 submitted a paper that explained the inheritance of quantitative traits through Mendelian factors
Fisher’s 1916 Paper: The Correlation Between Relatives On The Supposition of Mendelian Inheritance • Was rejected by several journals • Fisher personally paid to have it published by the Royal Society of Edinburgh in 1918 • When published, it ended all serious opposition to Mendelism • It established the genetic basis for natural selection • It laid the foundation for modern plant and animal breeding, and genetic epidemiology • It presented new statistical techniques (e.g., ANOVA -- ANalysis Of VAriance) soon used by virtually all empirical sciences.
Two Basic, Non-Mutually Exclusive Ways of Having Discrete Genotypes Yield Continuous Phenotypes • Polygenes • Environmental Variation
Polygenes More Loci Fewer Loci
Most Traits Are Influenced By Both Many Genes and Environmental Variation: Frequently Results in a Normal Distribution. E.g. Cholesterol in Framingham, MA Relative Frequency in Population 290 150 220 Total Serum Cholesterol in mg/dl
The Normal Distribution Can Be Completely Described by Just 2 Numbers: The Mean () and Variance ()
Let x be an observed trait value • The mean () is the average or expected value of x. • The mean measures where the distribution is centered • If you have a sample of n observations, x1, x2, …, xn, Then is estimated by:
The variance () is the average or expected value of the squared deviation of x from the mean; that is, (x-)2 • The variance measures the amount of dispersion in the distribution (how “fat” the distribution is) • If you have a sample of n observations, x1, x2, …, xn, Then given is estimated by: s2 = [(x1- )2 + (x2-)2 + … + (xn- )2]/n • If you do not know then is estimated by:
By 1916, Fisher Realized • Could Examine Causes of Variation, but not cause and effect of quantitative phenotypes. • Therefore, what is important about an individual’s phenotype is not its value, but how much it deviates from the average of the population; That is, focus is on variation. • Quantitative inheritance could not be studied in individuals, but only among individuals in a population.
The mean (average) phenotype for The entire population: ijPij/n Where n is the number of individuals sampled. Fisher’s Model Pij = + gi + ej
Fisher’s Model Pij = + gi + ej The genotypic deviation for genotype i is the Average phenotype of genotype i minus the Average phenotype of the entire population: gi = jPij/ni - Where ni is the number of individuals with genotype i.
Fisher’s Model Pij = + gi + ej The environmental deviation is the deviation Of an individual’s phenotype from the Average Phenotype of his/her Genotype: ej =Pij - jPij/ni = Pij-(gi+)=Pij--gi
Fisher’s Model Pij = + gi + ej Although called the “environmental” deviation, ej is really all the aspects of an individual’s Phenotype that is not explained by genotype in This simple, additive genetic model.
Fisher’s Model 2p = Phenotypic Variance 2p = Average(Pij - 2p = Average(gi + ej)2
Fisher’s Model 2p = Average(gi + ej)2 2p = Average(gi2 + 2giej + ej2) 2p = Average(gi2) + Average(2giej) + Average(ej2)
Fisher’s Model 2p = Average(gi2) + Average(2giej) + Average(ej2) Because the “environmental” deviation is really all the aspects of an individual’s Phenotype that is not explained by genotype, This cross-product by definition has an average Value of 0.
Phenotypic Variance Fisher’s Model 2p = Average(gi2) + Average(ej2) 2p = 2g + 2e
Fisher’s Model 2p = Average(gi2) + Average(ej2) 2p = 2g + 2e Genetic Variance
Fisher’s Model 2p = Average(gi2) + Average(ej2) 2p = 2g + 2e Environmental Variance (Really, the variance not Explained by the Genetic model)
Fisher’s Model 2p = 2g + 2e Phenotypic Variance = Genetic Variance+ Unexplained Variance In this manner, Fisher partitioned the causes Of phenotypic variation into a portion explained By genetic factors and an unexplained portion.
Fisher’s Model 2p = 2g + 2e Phenotypic Variance = Genetic Variance+ Unexplained Variance This partitioning of causes of variation can only be Performed at the level of a population. An individual’s phenotype is an inseparable Interaction of genotype and environment.
ApoE and Cholesterol in a Canadian Population 3/3 • = 174.6 2p = 732.5 Relative Frequency 3/4 4/4 2/2 2/3 2/4 Total Serum Cholesterol (mg/dl)
Step 1: Calculate the Mean Phenotype of the Population • = (0.592)(173.8)+(0.121)(161.4)+(0.234)(183.5)+(0.006)(136.0)+(0.024)(178.1)+(0.023)(180.3) = 174.6
Step 3: Calculate the Genetic Variance 2g= (0.592)(-0.8)2 +(0.121)(-13.2)2 +(0.234)(8.9)2 +(0.006)(-38.6)2 +(0.024)(3.5)2 +(0.023)(5.7)2 2g = 50.1
Step 4: Partition the Phenotypic Variance into Genetic and “Environmental” Variance 2p = 732.5 2g 50.1 2e 682.4
Broad-Sense Heritability h2B is the proportion of the phenotypic variation that can be explained by the modeled genetic variation among individuals.
Broad-Sense Heritability For example, in the Canadian Population for Cholesterol Level h2B = 50.1/732.5 = 0.07 That is, 7% of the variation in cholesterol levels in this population is explained by genetic variation at the ApoE locus.
Genetic Variation at the ApoE locus is therefore a causeof variation in cholesterol levels in this population. Broad-Sense Heritability ApoE does not “cause” an individual’s cholesterol level. An individual’s phenotype cannot be partitioned into genetic and unexplained factors.
Broad-Sense Heritability Measures the importance of genetic Variation as a Contributor to Phenotypic Variation Within a Generation The more important (and difficult) question Is how Phenotypic Variation is Passed on to The Next Generation.
= 174.6 2p = 732.5 Environment Deme Development h2B Meiosis Gene Pool 2 0.078 3 0.770 4 0.152 Random Mating Environment Deme ? 3/3 0.592 3/2 0.121 3/4 0.234 2/2 0.006 2/4 0.024 4/4 0.023 Development
Fisher’s Model • Assume that the distribution of environmental deviations (ej’s) is the same every generation • Assign a “phenotype” to a gamete
Phenotypes of Gametes • Average Excess of a Gamete Type • Average Effect of a Gamete Type • These two measures are identical in a random mating population, so we will consider only the average excess for now.
The Average Excess The Average Excess of Allele i Is The Average Genotypic Deviation Caused By A Gamete Bearing Allele i After Fertilization With A Second Gamete Drawn From the Gene Pool According To The Deme’s System of Mating.
The Average Excess Where gij is the genotypic deviation of genotype ij, tij is the frequency of ij in the population (not necessarily HW), piis the frequency of allele i, and:
Note, under random mating tii = pi2and tij = 2pipj, so: The Average Excess
Average Excess of An Allele Gene Pool Random Mating Deme
Average Excess of An Allele What Genotypes Will an 2 allele find itself in after random mating? Gene Pool
Average Excess of An Allele What are the probabilities of these Genotypes after random mating given an 2 allele? Gene Pool Random Mating Deme
These are the Conditional Probabilities of the genotypes Given random mating and a gamete with the 2 allele. Average Excess of An Allele Gene Pool Random Mating Deme
Average Excess of An Allele Gene Pool Random Mating Deme Environment h2B Development Genotypic Deviations Average Genotypic Deviation of a 2 bearing gamete = (0.770)(-13.2)+(0.078)(-38.6)+(0.152)(3.5) = -12.6
Average Excess of Allele 3 Gene Pool Random Mating Deme Environment h2B Development Genotypic Deviations Average Excess of 3 = (0.770)(-0.8)+(0.078)(-13.2)+(0.152)(8.9) = -0.3
Average Excess of Allele 4 Gene Pool Random Mating Deme Environment h2B Development Genotypic Deviations Average Excess of 4 = (0.770)(8.9)+(0.078)(3.5)+(0.152)(5.7) = 8.0