Download
1 / 31
330 likes | 606 Views
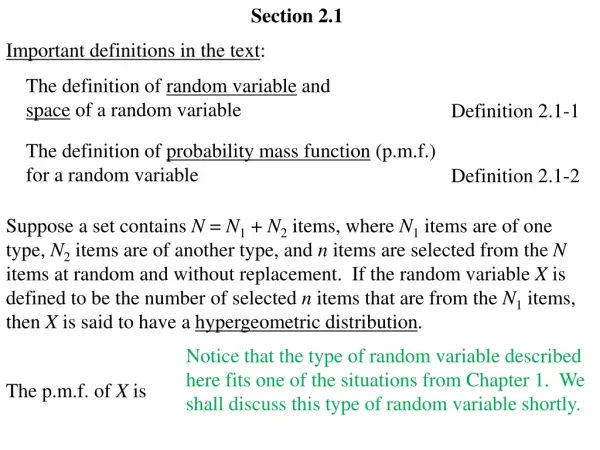
Section 2.1. Frequency Distributions and Their Graphs. Larson/Farber 4th ed. Section 2.1 Objectives. Construct frequency distributions Construct frequency histograms, frequency polygons, relative frequency histograms, and ogives. Larson/Farber 4th ed. Class width 6 – 1 = 5. Lower class

E N D
Section 2.1 Frequency Distributions and Their Graphs Larson/Farber 4th ed.
Section 2.1 Objectives • Construct frequency distributions • Construct frequency histograms, frequency polygons, relative frequency histograms, and ogives Larson/Farber 4th ed.
Class width 6 – 1 = 5 Lower class limits Upper class limits Frequency Distribution Frequency Distribution • A table that shows classes or intervals of data with a count of the number of entries in each class. • The frequency, f, of a class is the number of data entries in the class. Larson/Farber 4th ed.
Constructing a Frequency Distribution • Decide on the number of classes. • Usually between 5 and 20; otherwise, it may be difficult to detect any patterns. • Find the class width. • Determine the range of the data. • Divide the range by the number of classes. • Round up to the next convenient number. Larson/Farber 4th ed.
Constructing a Frequency Distribution • Find the class limits. • You can use the minimum data entry as the lower limit of the first class. • Find the remaining lower limits (add the class width to the lower limit of the preceding class). • Find the upper limit of the first class. Remember that classes cannot overlap. • Find the remaining upper class limits. Larson/Farber 4th ed.
Constructing a Frequency Distribution • Make a tally mark for each data entry in the row of the appropriate class. • Count the tally marks to find the total frequency f for each class. Larson/Farber 4th ed.
Example: Constructing a Frequency Distribution The following sample data set lists the amount spent on books for a semester. Construct a frequency distribution that has seven classes. Larson/Farber 4th ed.
Solution: Constructing a Frequency Distribution • Number of classes = 7 (given) • Find the class width Round up to 72
Solution: Constructing a Frequency Distribution • Use 30 (minimum value) as first lower limit. Add the class width of 72 to get the lower limit of the next class. • 30 + 72 = 102 • Find the remaining lower limits. Class width = 72
Solution: Constructing a Frequency Distribution The upper limit of the first class is 101 (one less than the lower limit of the second class). Add the class width of 72 to get the upper limit of the next class. 101 + 72 = 173 Find the remaining upper limits. Class width = 72 Larson/Farber 4th ed.
Solution: Constructing a Frequency Distribution • Make a tally mark for each data entry in the row of the appropriate class. • Count the tally marks to find the total frequency f for each class. Σf = 29 Larson/Farber 4th ed.
Determining the Midpoint Midpoint of a class Class width = 72
Determining the Relative Frequency Relative Frequency of a class • Portion or percentage of the data that falls in a particular class. Larson/Farber 4th ed.
Determining the Relative Frequency continued Sum of Rel. Freq.
Determining the Cumulative Frequency Cumulative frequency of a class • The sum of the frequency for that class and all previous classes. Sum of class and previous class.
frequency data values Graphs of Frequency Distributions Frequency Histogram • A bar graph that represents the frequency distribution. • The horizontal scale is quantitative and measures the data values. • The vertical scale measures the frequencies of the classes. • Consecutive bars must touch. Larson/Farber 4th ed.
Class Boundaries Class boundaries • The numbers that separate classes without forming gaps between them. • The distance from the upper limit of the first class to the lower limit of the second class is 102 – 101 = 1. • Half this distance is 0.5. 29.5 – 101.5 • First class lower boundary = 30 – 0.5 = 29.5 • First class upper boundary = 101 + 0.5 = 101.5 Larson/Farber 4th ed.
Class Boundaries Larson/Farber 4th ed.
Example: Frequency Histogram Construct a frequency histogram for the book costs frequency distribution. 21 Larson/Farber 4th ed.
frequency data values Graphs of Frequency Distributions Frequency Polygon • A line graph that emphasizes the continuous change in frequencies. Larson/Farber 4th ed.
Example: Frequency Polygon Construct a frequency polygon for the Books costs frequency distribution. Larson/Farber 4th ed.
Solution: Frequency Polygon The graph should begin and end on the horizontal axis, so extend the left side to one class width before the first class midpoint and extend the right side to one class width after the last class midpoint. This is bull! In most cases it is better to just show the data and not have false markers!
relative frequency data values Graphs of Frequency Distributions Relative Frequency Histogram • Has the same shape and the same horizontal scale as the corresponding frequency histogram. • The vertical scale measures the relative frequencies, not frequencies. Larson/Farber 4th ed.
cumulative frequency data values Graphs of Frequency Distributions Cumulative Frequency Graph or Ogive • A line graph that displays the cumulative frequency of each class at its upper class boundary. • The upper boundaries are marked on the horizontal axis. • The cumulative frequencies are marked on the vertical axis. Larson/Farber 4th ed.
Constructing an Ogive • Construct a frequency distribution that includes cumulative frequencies as one of the columns. • Specify the horizontal and vertical scales. • The horizontal scale consists of the upper class boundaries or upper limit. • The vertical scale measures cumulative frequencies. • Plot points that represent the upper class boundaries and their corresponding cumulative frequencies. Larson/Farber 4th ed.
Constructing an Ogive • Connect the points in order from left to right. • The graph should start at the lower boundary of the first class (cumulative frequency is zero) and should end at the upper boundary of the last class (cumulative frequency is equal to the sample size). Larson/Farber 4th ed.
Example: Ogive Construct an ogive for the book cost frequency distribution.
Solution: Ogive From the ogive, you can see that about 25 students spent $461 or less. The greatest increase in in cost occurs between $245 and $389. Larson/Farber 4th ed.
Section 2.1 Summary • Constructed frequency distributions • Constructed frequency histograms, frequency polygons, relative frequency histograms and ogives Larson/Farber 4th ed.