Download
1 / 11
150 likes | 199 Views
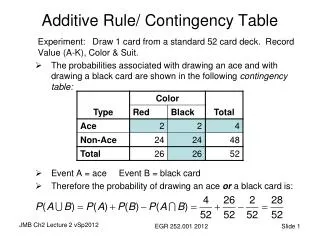
Test of independence: Contingency Table. Contingency table Hypotheses test for independence. Data Collection – Individuals are selected randomly from a population, and responses are cross-classified according to two characteristics of the individual.

E N D
Test of independence: Contingency Table Contingency table Hypotheses test for independence
Data Collection – Individuals are selected randomly from a population, and responses are cross-classified according to two characteristics of the individual. Example: Individuals are classified as either left or right handed, and as either blue or brown eyes. – The purpose is to see if there is a relationship between the two characteristics. For instance, is there a relationship between dominant hand and eye color?
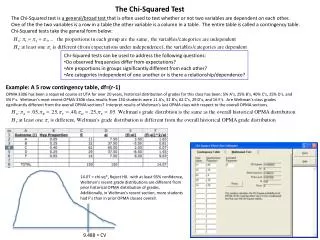
Test of Independence: Contingency Tables 1. Set up the null and alternative hypotheses. H0: Two variables are independent Ha: Two variables are dependent 2. Select a random sample and record the observed frequency, fij , for each cell of the contingency table. 3. Compute the expected frequency, eij , for each cell.
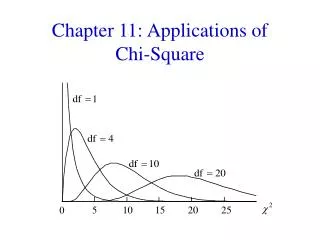
Reject H0 if p -value <a or . Test of Independence: Contingency Tables 4. Compute the test statistic. 5. Determine the rejection rule. where is the significance level and, with n rows and m columns, there are (n - 1)(m - 1) degrees of freedom. Note: The test statistic follows Chi-squared distribution only if all expected cell counts are greater than or equal to 5.
Contingency Table (Independence) Test • Example: Finger Lakes Homes (B) Each home sold by Finger Lakes Homes can be classified according to price and to style. Finger Lakes’ manager would like to determine if the price of the home and the style of the home are independent variables.
Contingency Table (Independence) Test • Example: Finger Lakes Homes (B) The number of homes sold for each model and price for the past two years is shown below. For convenience, the price of the home is listed as either $99,000 or less or more than $99,000. Price Colonial Log Split-Level A-Frame < $99,000 18 6 19 12 > $99,000 12 14 16 3
Contingency Table (Independence) Test • Hypotheses H0: Price of the home is independent of the style of the home that is purchased Ha: Price of the home is not independent of the style of the home that is purchased
Contingency Table (Independence) Test • Expected Frequencies Price Colonial Log Split-Level A-Frame Total < $99K > $99K Total 55 45 30 20 35 15 100
With = .05 and (2 - 1)(4 - 1) = 3 d.f., Contingency Table (Independence) Test • Rejection Rule Reject H0 if p-value < .05 or 2> 7.815 • Test Statistic = .1364 + 2.2727 + . . . + 2.0833 = 9.149
Contingency Table (Independence) Test • Conclusion Using the p-Value Approach Area in Upper Tail .10 .05 .025 .01 .005 c2 Value (df = 3) 6.251 7.815 9.348 11.345 12.838 Because c2 = 9.145 is between 7.815 and 9.348, the area in the upper tail of the distribution is between .05 and .025. The p-value <a . We can reject the null hypothesis.
Contingency Table (Independence) Test • Conclusion Using the Critical Value Approach c2 = 9.145 > 7.815 We reject, at the .05 level of significance, the assumption that the price of the home is independent of the style of home that is purchased.