Download
1 / 35
370 likes | 590 Views
Reducing Energy Costs in Water and Wastewater Treatment Systems. Cory Johnson, P.E. CH2M HILL Eastern US Practice Lead for Water Treatment, Membranes, and Reuse Cory.johnson@ch2m.com. 550 W Cypress Creek Rd Suite 400 Fort Lauderdale, FL 33309 954.351.9256.

E N D
Reducing Energy Costs in Water and Wastewater Treatment Systems Cory Johnson, P.E. CH2M HILL Eastern US Practice Lead for Water Treatment, Membranes, and Reuse Cory.johnson@ch2m.com. 550 W Cypress Creek Rd Suite 400 Fort Lauderdale, FL 33309 954.351.9256
Managing Energy Improves Sustainability while Reducing O&M Costs • Energy costs are rising • Annual energy cost of: • A Florida utility was $5.2M (2005) operating one WWTP (>30mgd) and 4 WTPs (ranging is size from 14 to 30 mgd) • A Georgia utility was ~$5.5M per year to operate two WTPs (170 mgd total capacity) • A 5% to 10% energy cost savings could result in of $250k to $500k annual savings
Energy Audit, Energy Management? • Energy Management Studies are not just ‘electrical’ • Energy efficiency evaluation process is a multi-disciplinary task • Evaluation team should include Process, Electrical, I&C, and HVAC Engineers, Operational Specialists, and Economists • Energy costs are a function of electrical, process, operations, and controls --- and economists!
Water Plant Energy Management • Pumping is typically ~90% of water system energy use • Ways to save energy cost: • Operational Optimization • Chemical • Energy • Operational and Capital Improvements • Rate Structures
Example where Smarter Operations Resulted in Significant Savings • Distribution system hydraulic model used to refine the existing operating plan to meet more strict water quality regulations and minimize operating costs for a 10 mgd system • 25% reduction in energy cost with Energy Market rate and revised pump controls and operations
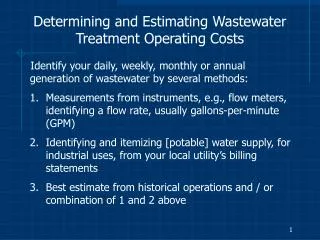
Steps to Perform an Energy Management Study Task 1: Project Kickoff and Chartering Task 2: Pre-Site Visit Review (Homework) • Review plant specific data • Familiarize with current operational procedures and control strategies • Analyze electrical bills • Evaluate plant electrical one-line diagrams • Identify major energy intensive processes (pumping, generation technologies, UV disinfection, blowers, HVAC, lighting) • Generate preliminary list of ideas for energy saving measures Task 3: Facility Evaluations (Site Visits) • Interview plant operational staff • Verify motor name plate data and confirm ‘run time’ on motors • Review processes which can be shifted to ‘off peak’ hours • Discuss and review control strategies for energy intensive processes • Review rate structures with operational staff
Steps to Perform an Energy Management Study (cont’d) Task 4: Data Evaluation and Modeling • Create a baseline energy usage model • Simulate existing plant operation and energy usage to calibrate • Run ‘what if’ scenarios by simulation of process and pumping various operating conditions • Evaluate control modifications to assess potential energy savings • For energy saving opportunities that require capital expenditures, compute: • Capital Cost • Annual Energy Savings • Payback period • Estimate energy savings from shifting operations to ‘off-peak’ • Recommend electrical modifications to take advantage of rate structure Task 5: Report Preparation Task 6: Final Workshop and Presentation
Areas of Focus during Assessment • Evaluate the energy rate structure • Identify peak and off-peak periods and any power factor penalties • Investigate feasibility of installing power factor improvement capacitors • Evaluate installation of energy monitoring equipment which can be interfaced into the SCADA system • Evaluate lighting to recommend ways to save energy by better control of lighting circuits • Recommend improvements in the electrical systems that would improve efficiency, reliability, and safety • Investigate major pumping systems • Evaluate all plant treatment processes • Evaluate HVAC systems
Categorization of Assessment Recommendations • Summarize and categorize each recommendation with “pros and cons” for each category • Category #1: “Low Hanging Fruit” • Can be almost immediately implemented • No capital cost • Reasonable energy savings • Category #2: Actions requiring minimum to moderate capital investment with payback of 1 to 5 years • Category #3: Actions that may require significant capital investment, but could pay back in 5 to 7 years
Example Water Treatment Plant Process Flow Transfer Pumping Media Filtration Softening Aeration Well Pumping To Storage & High Service Pumping Cartridge Filters SandStrainers Membrane Softening Aeration/ Degasification
Energy Audit Results at WTPs Example: Lime Softening and Ozone 19
Examples of Energy Audit Results at WTPs • Pump sizing vs. valve throttling • 25 well pumps (75 to 100 hp) • Discharge valves throttled to maintain well drawdown and reduce pressure to match RO facility requirements • 2.7 million kW-hr of additional energy used ---- additional $150,000 in annual energy costs • Program implemented to replace all the pumps with 40 to 50 hp motors with AFDs • OSHG Programming Logic Modifications • Modified programming logic to change generation time from peak hours of 12pm to 9pm to off peak hours of 12am to 9am • $18k annual cost savings 23
Efficient Pump Combinations BEP BEP $$ $$
Wastewater Pump Station Analysis – Operational Changes • 15 MGD system • Review pump curve efficiencies, power draw, runtimes, and energy bills • Recommended alternate operating scenarios for pump station to maximize existing efficiency • Analysis of cost for running one pump versus two pumps at 70% or 80% capacity. • Identified that to pump the same amount of water, it can cost 50% less using two pumps versus one, in 30% less time. • Results vary based on pump curves.
What is Codigestion? • Direct addition of high-strength organic wastes to municipal wastewater anaerobic digesters • Typical high-strength organic wastes • Fats, oils, and grease (FOG) • Restaurant food scraps • Food processing wastes • Off-spec cola syrups • Dairy wastes • Cheese Wastes • Brewery Wastes • Winery Wastes • Others
Advantages of Codigestion • Technical • Removes FOG from sewer collection systems • Removes FOG materials from headworks and primary clarifiers • Removes organic loadings on liquid treatment train • Increases digester utilization • Economic • Produces more biogas for beneficial uses (CHP, dryer, vehicles, etc.) • New revenue streams from tipping fees • Reduces O&M costs for headworks and liquid treatment trains • Environmental • Reduces landfilling of high-strength wastes (HSW) • Reduces emission of greenhouse gases
Challenges of Codigestion • Possible need for digester upgrades • Additional capital and O&M costs for FOG/HSW receiving and processing • Additional paperwork for permitting, waste receipts, billings • Debris removal and disposal • Potential negative anaerobic digester performance impacts • Potential anaerobic digester toxicity from HSW • Potential increase in nutrient concentrations in sidestreams
Johnson County, Kansas Middle Basin WWTP – 12.5 mgd (14.5 mgd Capacity)
Process Flow Diagram FOG/HSW are blended sequentially with primary sludge and thickened WAS
Performance Based Contracts with Energy Services Companies • Energy Service Company (ESCo or ESCO) based project (certification required) • ESCO has become a generic term for Energy Performance Contracts • Started in 1970s with lighting, developed in 1980s with hospitals and matured in 1990s with buildings (HVAC, lighting, building energy management) • Today moving from buildings to all aspects of energy efficiency (street lighting, traffic control, water and wastewater operations) • International Performance Measurement and Verification Protocol (IPMVP) used to measure before and after energy use • Typically use “Performance Contracting” to finance and implement projects as part of a Guaranteed Energy Performance Contract (GEPC) • Finance is normally from the private sector
Guaranteed Energy Performance Contracting (GEPC) • GEPC evaluates a project or a program and develops an agreement with a fixed (guaranteed) capital cost and operational savings for the program • Much like a Design Build agreement • Added in is the energy performance guarantee • Methods of capital investment • Utility floats bond based on program value (not common) • Outside financing • Inside financing • The contractor capital or the bond is paid back with savings from program (e.g., shared savings concept) • Government regulated terms and conditions usually 10 to 20 year term for payback (formal ESCO) • GEPC Contractor financed projects normally self limited to investment in projects with 3 to 10 year payback
Services Covered by Energy Performance Contracting • Anything related to energy or green related savings including: • Standard Energy Conservation Measures – Lights, traffic lights, HVAC controls, etc. • Non-revenue water reduction • Bio-solids reduction • Digester gas to energy production • Water metering – reduction of non-revenue water • Pumping savings (water distribution, wastewater collection) • Distribution system optimization • Wastewater treatment mechanical upgrades (e.g., blowers) and process upgrades • Adding renewable energy to the utility’s portfolio (normally blended approach) • Energy procurement strategies to reduce overall energy costs
Driving Factors for a Energy Performance Contract Driving Factors for a Energy Performance Contract Driving Factors for Convention Project Approach Utility has financial capacity Utility knows exactly what project they want – no variables Limited Project Risk • Utility does not have financial capacity (e.g., lacks bonding capacity) • Utility wants to holistically look at their energy consumption and carbon footprint • Utility knows that there is a project but not sure of the details or how to finance • Risk Transfer
Case Study - Wilmington, DE – Operational and Capital Improvements with ESCO Funding • Wilmington serves 100,000 people MGD • Cash strapped city with big “Green” expectations • Period of performance is 20 years as per Delaware state ESCO law • Program designed to: • Reduce energy and operational costs • Reduce GHG emissions • Insulate the City from future electricity and biosolids cost escalation through renewable energy generation and sludge volume reduction
Phase 1 of the program includes city‐wide energy conservation measures, peak demand reduction and solar generation • Over $400,000 in annual net savings through renewable generation, energy use reduction and energy price reduction • Approximately $180,000 of construction period savings have already been realized • The City has received national recognition for its successful deployment of ARRA stimulus funds for renewable energy and infrastructure improvement
Phase 2 intended to provide a long term biosolids management solution • Cogeneration of inexpensive renewable fuel (methane) will supply plant electric demand and heat for thermal drying of biosolids • Thermal drying will reduce biosolids volume by over 80% and eliminate cost and regulatory uncertainties associated with off-site trucking/land application • Combined, both phases result in 50% of City’s energy demand supplied by renewable generation and achievement of 20% greenhouse gas reduction goal under the Climate Protection
Summary • Water and Wastewater Treatment Continue to Increase in Energy Intensity • As water quality regulations become tighter, kW-hr/MG increases • Significant Opportunities to find Energy Savings in Plants and Piping Systems • Energy management studies are a multi-disciplinary effort and focused on more than just ‘electrical’ • Level of effort can be tailored to specific studies
Summary • Holistic plant optimization studies can incorporate chemical feed optimization • FOG programs represent a potential revenue source and additional fuel source when considering codigestion • ESCOs and GEPCs can bring funding for projects using energy savings 25