Download
1 / 7
70 likes | 258 Views
Data for review only: Details of Figure 7. Control Long- Short-. BEAS-2B. 4.3986±0.5524. 0.0 0.5 1.0 1.5 2.0 2.5 3.0 3.5 4.0 4.5 5.0. Normalized Cell Index. 1.6535±0.1479. 0.3819±0.0611.

E N D
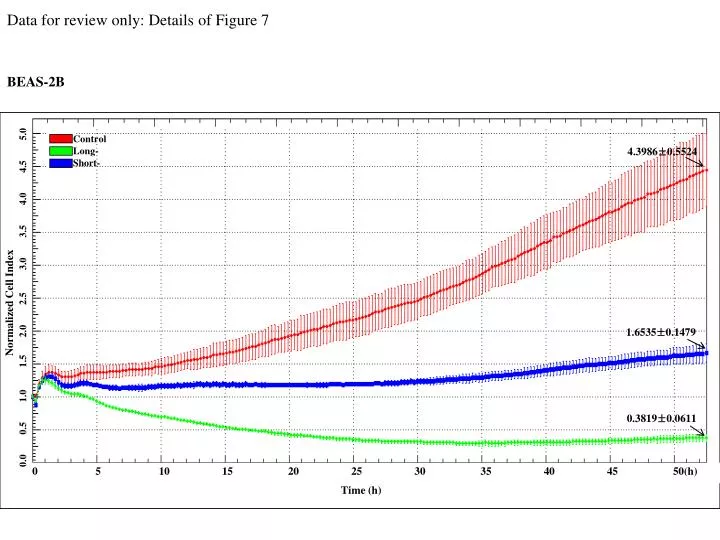
Data for review only: Details of Figure 7 Control Long- Short- BEAS-2B 4.3986±0.5524 0.0 0.5 1.0 1.5 2.0 2.5 3.0 3.5 4.0 4.5 5.0 Normalized Cell Index 1.6535±0.1479 0.3819±0.0611 0 5 10 15 20 25 30 35 40 45 50(h) Time (h)
Data for review only: Details of Figure 7 HEK-293 12.5824±2.1454 0.0 2.0 4.0 6.0 8.0 10.0 12.0 14.0 16.0 Normalized Cell Index 4.5451±0.7240 2.0082±0.2314 0 5 10 15 20 25 30 35 40 45 50(h) Time (h)
Data for review only: Details of Figure 7 HACAT 4.3829±0.4873 4.2486±0.2419 4.1676±0.1535 1.0 1.5 2.0 2.5 3.0 3.5 4.0 4.5 5.0 Normalized Cell Index 0 5 10 15 20 25 30 35 40 45 50(h) Time (h)
Data for review only: Details of Figure 7 T98G 18.511±1.5273 10.4445±1.1393 0.0 5.0 10.0 15.0 20.0 25.0 Normalized Cell Index 4.8235±0.9358 0 5 10 15 20 25 30 35 40 45 50(h) Time (h)
Data for review only: Details of Figure 7 H9C2 1.9217±0.0720 0.9 1.1 1.3 1.5 1.7 1.9 2.1 1.2387±0.0549 Normalized Cell Index 1.1228±0.0573 0 5 10 15 20 25 30 35 40 45 50(h) Time (h)
Data for review only: Details of Figure 7 Chang 1.5452±0.0143 1.4596±0.1412 0.9 1.0 1.1 1.2 1.3 1.4 1.5 1.6 1.7 Normalized Cell Index 1.0486±0.0060 0 5 10 15 20 25 30 35 40 45 50(h) Time (h)
Data for review only: western blotting data of some cell death-related proteins Bcl-2, BAX, and cytochrome C : apoptosis, Beclin1: autophagy Long- Short- Con. 2.5 5 2.5 5 (mg/kg) Bcl-2 BAX Cytochrome C Beclin1 Actin P-ERK SOD-1