Download
1 / 18
180 likes | 265 Views
Aboriginal fatalities on NSW roads from 2000 to 2009. Prepared November 2010. Outline. The data and matching process Rates of fatality National NSW Characteristics of crashes Characteristics of traffic units involved Characteristics of persons. Data set.

E N D
Aboriginal fatalities on NSW roads from 2000 to 2009 Prepared November 2010
Outline • The data and matching process • Rates of fatality • National • NSW • Characteristics of crashes • Characteristics of traffic units involved • Characteristics of persons
Data set • Crashes involving Aboriginal fatalities from 2000 to 2009 • Received 116 records from NCIS • Matched to RTA CrashLink database • Exclusions made • Result 90 ‘matched’ fatalities in 87 crashes
Some limitations • Accurate data collection • Identification of Aboriginality • Aboriginal population may be underestimated? • Delays in coronial process
87 crashes from 2000 to 2009 Fatal crash
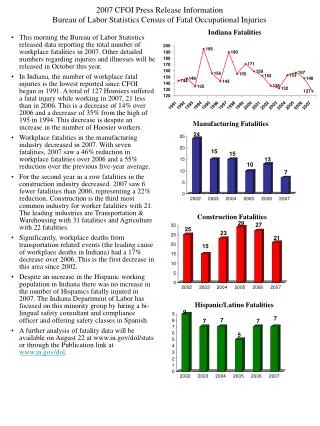
50 Aboriginal 45 Non-Aboriginal 40 35 30 25 Number of fatalities per 100000 people 20 15 10 5 0 1999 2001 2003 2005 2007 2009 Year National comparisons – WA • Rate of fatality from road crashes 3 times greater in Aboriginal population • This example is from Western Australia
Aboriginal 50 Non-Aboriginal 45 NRSS Goal 40 35 30 25 Number of fatalities per 100000 people 20 15 10 5 0 1999 2001 2003 2005 2007 2009 Year National comparisons - average • At least 2 times greater?
Aboriginal 50 Non-Aboriginal 45 40 35 30 25 Number of fatalities per 100000 people 20 15 10 5 0 1999 2001 2003 2005 2007 2009 Year National comparisons – NSW • Different pattern? • Or under-reporting?
Characteristics of crashes • Road Classification • Crash Movement • Time of Day * • Day of Week • Urbanisation * • Speed limit • Weather • Etc.
1 Aboriginal 0.9 0.8 0.7 0.6 0.5 Cumulative proportion of crashes 0.4 Non-Aboriginal 0.3 0.2 0.1 0 10 25 50 100 Distance (km) from an Aboriginal community Locations of crashes – Communities • More crashes within smaller distances from Aboriginal communities
Map of crashes and communities community crash
Similar percentages of cars, fewer motorcycles, more pedestrians More articulated trucks? 60 Aboriginal Characteristics of traffic units - type Non-Aboriginal 50 40 30 Percentage of crashes 20 10 0 car bus light truck pedestrian pedal cycle motorcycle heavy rigid truck articulated truck other / unknown Type of traffic unit
Previous studies: Aboriginal vehicles may contribute to crashes This study: Vehicles are older on average but no equipment failure recorded in crashes 50 Aboriginal Traffic units – age of vehicle Non-Aboriginal 45 40 35 30 Percentage of motor vehicles 25 20 15 10 5 0 Unknown <1980 1980-1989 1990-1999 2000-2009 Year of manufacture
Previous studies: Aboriginal vehicles had more occupants This study: More vehicles with 3, 4, 5 occupants, but only one with more occupants than seats 100 Aboriginal Traffic units - overcrowding 90 Non-Aboriginal 80 70 60 50 Percentage of vehicles 40 30 20 10 0 1 2 3 4 5 6 7 8 Number of occupants
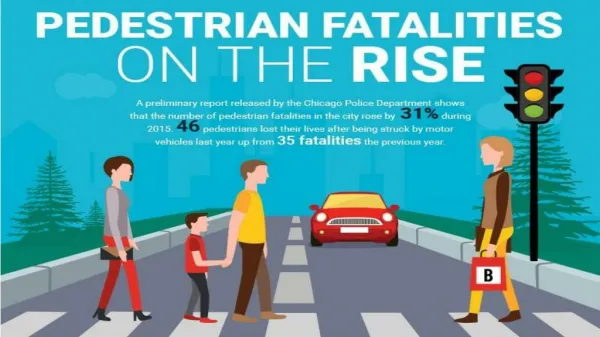
Aboriginal Non-Aboriginal 70 Characteristics of persons – type of road user 60 50 • Previous studies: • increased number of pedestrian fatalities • This study: • Pedestrians & Passengers • Motorcyclists & Drivers 40 Percentage of fatalities 30 20 10 0 Driver Passenger Motorcyclist Pedal Cyclist Pedestrian Other Road User Class
Characteristics of persons • Age and gender • Twice as many males as females • Fewer older Aboriginal fatalities – reflecting population • Licensing • 18 of 36 unauthorised (50%) vs. only 9% for non-Aboriginal population • Alcohol • 50% of Aboriginal drivers and riders over 0.05 (vs. only 26%) • 59% of pedestrian fatalities were heavily intoxicated - 0.150 or more (vs. 19%) • Restraints • 33% of Aboriginal MV fatalities not wearing restraints (vs. 21%)
Conclusions • Issues arising from this report: • Reporting of Aboriginal status in road crashes in NSW • Possible data linkages with other databases e.g. health • Results indicating the following risk factors: • Licensing • Alcohol • Restraints • Pedestrians • Location considerations: • Aboriginal communities