Download
1 / 12
120 likes | 258 Views
Summary: remote sensing/ disturbance. Key RS contributions; timing and magnitude of disturbance; attribution (human/natural ) Looks for TRENDS and EVENTS in the same algorithm Choice of spectral index matters (multi-proxy approach to improve certainty?)

E N D
Key RS contributions; timing and magnitude of disturbance; attribution (human/natural) • Looks for TRENDS and EVENTS in the same algorithm • Choice of spectral index matters (multi-proxy approach to improve certainty?) • Spectral scope matters for diagnosing components of change • Very dynamic landscape (slow+fast processes)
How to use this data in the PeCAN scaffolding approach? • How to represent change? (can cherry pick long vs. fast changes – which is desired?) • How to capture the landscape story? • Have people in the loop! • Use algorithms to find change (add clustering to reduce complexity) • Source of ‘truth’; ancillary database add richness + error • Find places in data space where training data NOT good
Challenges: Technical: clouds, data processing • Representational: Condensing time-series data into digestible form: characterizing uncertainty in detection and attribution • Integrational: how to bring long and slow processes into models? How to represent in accounting? – good ways to constrain model output/management!
New, repeat Lidar for validation • Look for correlations in the data with candidate processes • Let process/remote sensing guide the sampling • Families of change – useful for accounting • How representative are the towers? • Across disturbance-change families • Across landtypes
Data-fusion • Multi-proxy indices for change detection? • Diagnose multiple spectral signatures • GIS overlay analysis: use all spatial data to look for correlation in space and time • Need to diagnose representativeness of towers • Need to relate to soils (e.g., TWI) and water • Available now: events, abrupt change, attribution • Need to consider: chronic events, path dependency
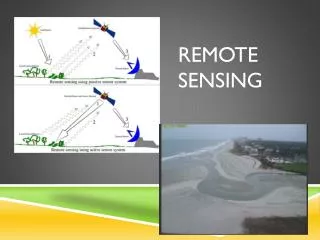
Remote sensing • Methodology: Capturing a complex landscape • Chronic + episodic changes! • Multi-proxy change: Spectral indices and attribution • Cluster change types/agents into meaningful carbon story? • How to add uncertainty into remote sensing algorithms? • Survey.. • Working across different platforms: Landsat, lidar, hyperspectral • Data fusion – bringing RS into scaffolding • Anticipate iteration any time data/outputs are handed off to the next group • Spread the word: There is value to providing spatial data/maps/outputs in a form where serendipity occurs
Products – spatial • Canopy lidar– top of canopy topography, height metrics (percentile of returns by height, rumple) , bare Earth elevation • Derived products: fractional cover, LAI, biomass, stem number, crown sizes • Radar (PALSAR) – structural metrics (return intervals by polarization), wet area delineation, species cover with optical • Derived: biomass • AVIRIS - % leaf N, LMA, leaf C (or C:N), lignin/cellulose, metabolic parameters, Chl, carotenoids, Leaf water content, canopy shadow fraction, bunch of indices, species cover or functional groups • FSVEG – land type association • NSCN (soil carbon network), SSURGO/NRSC, USFS soil survey, • Topographic wetness indices and other • Landsat: Year, type, intensity of disturbance and trends + cloud-free yearly composite imagery • MODIS: phenology • Fine resolution imagery (Quickbird) + manual delineation
Land Management Summary • Bridging gaps land managers and ecologists • Common theme. Information sharing: reliability of projections in management plans. • Need feedbacks loops between foresters and researchers. Different carbon cycle model for each land management scenario • Dissemination. Forums for communication, outreach from the science. Perpetual Cheas. Technical reports. • USFS is not just a variable to study. USFS as client. Think big – decisions comes from higher levels • Representativeness of our research to management goals • what can models teach us about management? Can we move beyond the paradigm of uneven age management by exploring ChEAS data/models? Can we make credible projections of carbon with respect to landscape structure and management options? Climate adaptation/mitigation as the bridge. • How representative are our flux towers? What’s the right message from these with respect to land managers • Managers already use a number of tools and reports. Should we test those? Learn from those? How to communicate uncertainty. Focus on scenario building. • ChEAS can contribute to how harvest impacts carbon sequestration. Pre/post thinning as an experiment • Traveling roadshow approach with manager, but shouldn’t ignore products created. Engage: Chris Swanston, Rich Birdsey • What do we get? Broader impacts. Pubs? Humans on the landscape – socioecology. USDA funding is an option – involve economists, USFS personnel, extension • Learn then build proposal or paper.
Spatial products • Define boundaries, 7x7 cutouts
Modeling • Barriers to model: Model tweaking, making multi-model runs easy – information workflow setup/traceability, model switches in pecan • User operability testing, designed help, iphone app • use pictures to ground-truth? • User visualization/diagnostic • Benefits to end-users, access control to providers, conventions for citation of models/data, provide output for these, use history tacking – provide URL • Model agnosticism – try use Pecan with PSU-LUE model: HBLUE • Spatial design – do a ChEAS field experiment inspired by model data assimilation. • Statistical tests to help the novice user • Solving the data void problem. Inconsistent data problem.
Uncertainty • Uncertainties we despise • The ones without uncertainty • Uncertain on our confidence in uncertainty – the level • When the end users or scientists demand you make up at uncertainty when you have no way to easily produce one • Uncertainties we like • Spatial vs temporal uncertainty – report both • Better metadata on the uncertainty • Uncertainties with a confidence level, standards, driven by a question • Honesty. Terminology matters- confidence, precision. Visualization matter • Uncertainties that change in time? • ChEAS can certainly collaborate on uncertainty. How? • Use uncertainty to target fieldwork • Forecasting uncertainty • Stratified sampling • Identify among ourselves what are meaningful for carbon, define standards, isolate uncertain data • Can we detect a change? Threshold? Adaptive management – when you react.