Download
1 / 18
180 likes | 374 Views
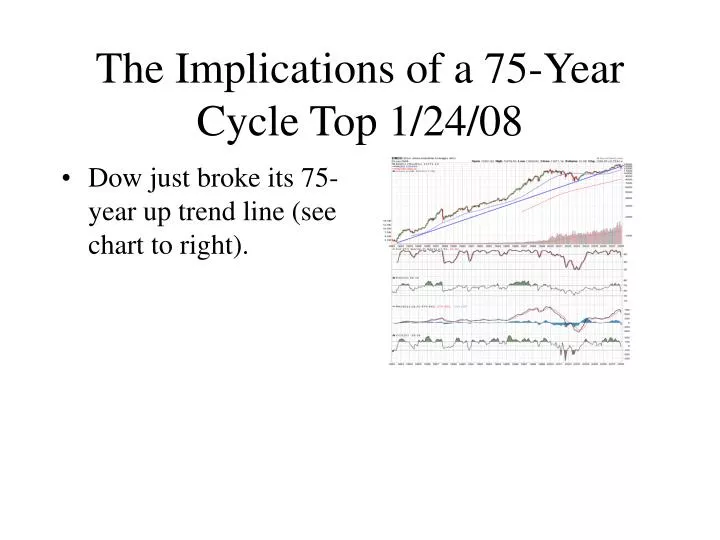
The Implications of a 75-Year Cycle Top 1/24/08. Dow just broke its 75-year up trend line (see chart to right). The Implications of a 75-Year Cycle Top – One Year Later. Dow Jones Industrials declined from 11,921 to 6,463 Has closed below its 50-month moving average for first time since 1985!

E N D
The Implications of a 75-Year Cycle Top 1/24/08 • Dow just broke its 75-year up trend line (see chart to right).
The Implications of a 75-Year Cycle Top – One Year Later • Dow Jones Industrials declined from 11,921 to 6,463 • Has closed below its 50-month moving average for first time since 1985! • Has closed below its 200-month moving average for first time since 1975!
Conventional Wisdom of Last 75 Years is No Longer Valid 1/24/08 • There is always a “January Effect” rally. • SPX declined an unprecedented 16.4% between 12/11/07 and 1/22/08.
Conventional Wisdom of Last 75 Years is No Longer Valid – One Year Later • SPX Declined 6.6% between 12/11/08 and 1/22/09 • Once again, there is no “January Effect.”
Conventional Wisdom of Last 75 Years is No Longer Valid 1/24/08 • Utilities is a safe haven for money in a bear market. • Dow Jones Utilities Average declined 13.9% between 1/8/08 and 1/22/08.
Conventional Wisdom of Last 75 Years is No Longer Valid – One Year Later • Utilities was indeed not a safe haven for money in 2008. • Dow Jones Utility Average declined 31.7% in 2008! • It declined 23.4% between 1/6/09 and 3/9/09 alone!
Conventional Wisdom of Last 75 Years is No Longer Valid 1/24/08 • The Far East boom creates endless demand for commodities, making them a hedge against declining stock prices. • The CCI Index peaked 1/16 and should decline at least 15% this year.
Conventional Wisdom of Last 75 Years is No Longer Valid – One Year Later • CCI Index peaked 7/3/08 at 615.04 and declined 47.5% to 322.53 on 12/5/08! • The Far East bust has revealed little demand for commodities, causing them to crash!
Conventional Wisdom of Last 75 Years is No Longer Valid 1/24/08 • Gold moves in the opposite direction to stocks and is therefore a hedge against declining stock prices. • Gold peaked on 1/14 at 916.10 and declined 7.4% by 1/22.
Conventional Wisdom of Last 75 Years is No Longer Valid – One Year Later • Gold declined 27.3% between 10/10/08 and 10/24/08 while the SPX declined 12.1%. • Gold rose 11.8% between 11/21/08 and 1/5/09 while the SPX rose 27.4%. • Gold declined 10.6% between 2/20/09 and 3/4/09 while the SPX declined 14.3%.
Conventional Wisdom of Last 75 Years is No Longer Valid 1/24/08 • Since International Stocks are typically contra-cyclical to domestic ones, it makes sense to overweight one’s portfolio with them. • The S&P Euro 350 peaked last October simultaneous with the Dow and then declined 23.2%!
Conventional Wisdom of Last 75 Years is No Longer Valid – One Year Later • The S&P Euro 350 declined 46.1% in 2008 as the SPX declined 39.4% - certainly was not contra-cyclical! • It has virtually traded in sync with the SPX since the October 2007 peak.
The Implications of a 75-Year Cycle Top 1/24/08 • A 75-year bull cycle cannot be corrected by a minor bear market – it takes a super bear to correct a super bull. • During the past 75 years, bear markets averaged 15 months in length, but a super bear will last 36-48 months! • During the last 75 years, the average bear market decline was 23%. • We expect this super bear to contain a series of such declines interrupted by several short but sharp rallies of as much as 20%. • Therefore, we expect volatility to remain at double its formerly normal level.
The Implications of a 75-Year Cycle Top – One Year Later • We are clearly in a super bear market. • Thus far this super bear has lasted 17 months and counting! • From high to low, the SPX has declined 57.7%! • So far, we have had three declines of 20.2%, 48.3%, and 29.6%, and two two short, sharp rallies of 20.4% and 26.9%. • The VIX Index rose 526.3% from 17.01 on 5/19/08 to a record 89.53 on 10/24/08!
How PatternWatch Performed in 2008 • Average Gain of 128 Trades • 42.94% • % Profitable: 109/128 • 85.20% • Average Gain of 110 Stock Trades • 51.51%
The Implications of a 75-Year Cycle Top – Where We Go From Here – Part 1 • SPX has just closed below its 28-year up trend line, indicating a bearish long-term trend. • We expect the first half of this super bear market to bottom in late March 2009 at SPX 625 and Dow 6250. • We then expect the typical mid-bear rally to SPX 950 and Dow 9300 by late June 2009. • Then we expect the second, and worst, half of the bear to decline to SPX 392 and Dow 3900 by late December 2012. • Note: Typically the worst economic developments and indicators of the downturn do not occur until the second half of the bear, i.e., late summer/early fall 2009.
The Implications of a 75-Year Cycle Top – Where We Go From Here – Part 2 • Economic Stimulus plan and Fed quantitative easing both fail, leading to runaway deflation in second half of 2009. • CCI index declines to 175 by year-end 2009. • Gold declines to under $200/oz by year-end.
My Contact Information • Steven M. Frenkel, CFA • Chief Technical Analyst, PatternWatch • Office: 201-797-3419 • Cell: 201-410-9335 • Fax: 201-797-4241 • Email: frenkly@verizon.net