Download
1 / 42
430 likes | 595 Views
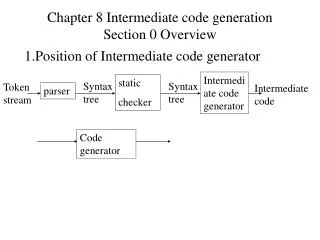
Microsoft Excel – Intermediate Level. While Waiting (Do Now). Launch Excel Type in your name in cell A1 Enter three additional names in same column and salaries in the next column Resize Column Rename worksheet Change worksheet tab to color. Standard Addressed.

E N D
Microsoft Excel – Intermediate Level SPS Technology Department
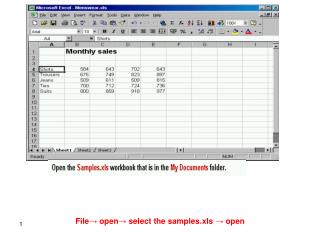
While Waiting (Do Now) • Launch Excel • Type in your name in cell A1 • Enter three additional names in same column and salaries in the next column • Resize Column • Rename worksheet • Change worksheet tab to color SPS Technology Department
Standard Addressed Standard 1: Demonstrate proficiency in the use of computers and applications as well as an understanding of concepts underlying hardware, software, and connectivity. SPS Technology Department
Intermediate Excel By the end of this session you will know and be able to: • Enter formulas and functions; use the auto-fill feature in a spreadsheet application. • Produce simple charts and graphs from a spreadsheet. • Use various number formats (e.g., scientific notation, percentages, exponents) as appropriate. • Differentiate between formulas with absolute and relative cell references. • Customize formatting of charts or graphs created in spreadsheet applications. • Utilize if-then, freeze frame, and data validation SPS Technology Department
You Will Demonstrate This By • Creating a grade book with an appropriate chart SPS Technology Department
Page Set-Up OptionsMenu Bar>File>Page Setup . . . • Page tab • Sheet tab • Margins tab • Headers/Footers tab SPS Technology Department
Advanced Formatting Features • Alignment • Text Wrapping • Orientation of cells SPS Technology Department
Wrap text within Cell SPS Technology Department
Creating Charts using Excel SPS Technology Department
Types of Charts/Graphs • A Bar charts show the differences amongst similar things at a point in time • A Pie charts allows us to compare parts of the whole with each other • A Line chart is a good way to look at changes over time or over space SPS Technology Department
Charting Features of Excel Watch video from Create Graphs and Charts Microsoft Excel Tutorials SPS Technology Department
To Create a ChartHighlight Cells you want to include SPS Technology Department
On Standard Toolbar click Chart Wizard SPS Technology Department
Select the Chart that fits your purpose. SPS Technology Department
Legend SPS Technology Department
Chart Location On different worksheet On same worksheet SPS Technology Department
You can resize and move chart SPS Technology Department
Online Resources – Examples of Charts/Graphs • Line Graphs http://www.nccei.org/wordguide/linechart.html • Column Chart http://www.bcschools.net/staff/ExcelHelp.htm#Chart • Simple Charts http://www.sps.springfield.ma.us/ProfDev/payne/chartseasy.html SPS Technology Department
Using the Fx Functionto Perform Calculations SPS Technology Department
Summing Ranges SPS Technology Department
Calculating Advanced Formulas using Excel Functionson Formula Bar fx SPS Technology Department
Using Functions in Excel SPS Technology Department
Average – Also Called the Mean SPS Technology Department
Using Formulas in a Worksheet • In the formula bar click on Fx Another way to access the Formula Function Feature SPS Technology Department
Sum Function SPS Technology Department
Range you wish to sum Column Range A1:A25 Row Range: A1:E1 SPS Technology Department
Mean, Median, Mode & Count • The Mean is the Average • The Median is the number in the middle of a set of numbers; that is, half the numbers have values that are greater than the median, and half have values that are less. • The Mode returns the most frequently occurring or repetitive value in a range of numbers • The Count gives a numeric value to the number of cells in a range SPS Technology Department
= B2+B3 = C2+C3 = D2+D3 = B2/$E$15 = C2/$E$15 = D2/$E$15 Value in cells become relative when formula is copied Value in cells remain absolute when formula is copied Relative Reference –vs.- Absolute Reference SPS Technology Department
Checks whether a condition is met.Returns one value if TRUE, and another value if FALSE. IF Function • =IF(A1>=60,"Pass","Fail") Conditional Operator True value will produce Pass False Value will produce Fail Value in Cell Greater Than or Equal to 59 SPS Technology Department
Conditional FormattingHighlight Range> MenuBar> Format>Conditional Formatting . . . SPS Technology Department
Freeze Panes • Highlight row underneath the row you want to freeze • Highlight column to the right that you wish to freeze • Menu Bar > Window > Freeze Panes SPS Technology Department
Printing Headings on All Sheets SPS Technology Department
Create a Drop-Down List Referred to as a Data Validation List • Input in a range a list of frequency used data. Either in same worksheet or different worksheet. • Menu Bar • Data • Validation . . . . . SPS Technology Department
Data Validation Dialog Box Choose List =$A$1:$A$25 Range were values are found SPS Technology Department
Your Turn… • Create a grade book with an appropriate chart SPS Technology Department
Intermediate Excel Teacher Name: ________________________________________ Student Name: ________________________________________ SPS Technology Department