1 / 1

Figure 5. Life expectancy by race and sex: United States, 1970-2006

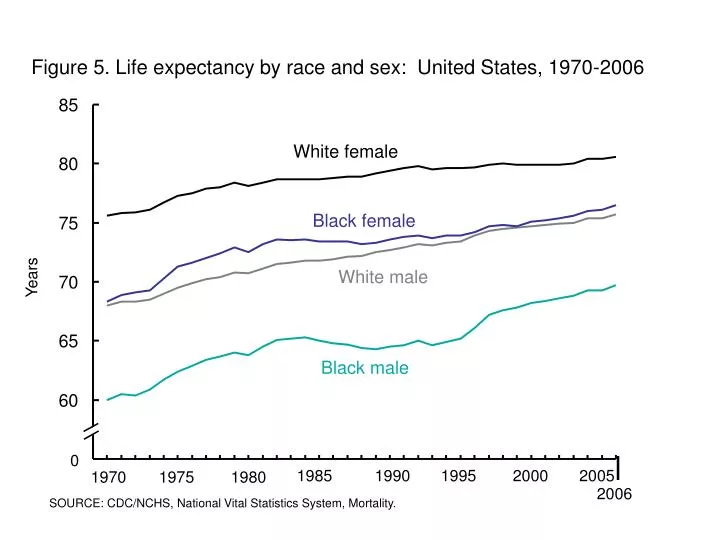
0. Figure 5. Life expectancy by race and sex: United States, 1970-2006. White female. Black female. Years. White male. Black male. 1985. 1990. 1995. 2000. 2005. 1970. 1975. 1980. 2006. SOURCE: CDC/NCHS, National Vital Statistics System, Mortality.

esben
Download Presentation

Figure 5. Life expectancy by race and sex: United States, 1970-2006

An Image/Link below is provided (as is) to download presentation Download Policy: Content on the Website is provided to you AS IS for your information and personal use and may not be sold / licensed / shared on other websites without getting consent from its author. Content is provided to you AS IS for your information and personal use only. Download presentation by click this link. While downloading, if for some reason you are not able to download a presentation, the publisher may have deleted the file from their server. During download, if you can't get a presentation, the file might be deleted by the publisher.

E N D

Presentation Transcript


  1. 0 Figure 5. Life expectancy by race and sex: United States, 1970-2006 White female Black female Years White male Black male 1985 1990 1995 2000 2005 1970 1975 1980 2006 SOURCE: CDC/NCHS, National Vital Statistics System, Mortality.

More Related