Download
1 / 23
240 likes | 330 Views
Decision Making for Results. Decision Making for Results (DMR).

E N D
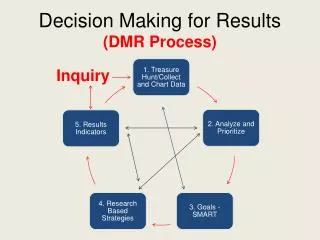
Decision Making for Results (DMR) DMR is a six-step process that allows you to examine your school or district data at the macro level. After analyzing this data in a collaborative manner, you will be able to make leadership and instructional decisions to guide your continuous school improvement.
Principles of Decision Making for Results (DMR) Antecedents Adult Actions (Cause Data) * Instructional Strategies * Administrative Structures * Conditions for Learning Accountability Collaboration • * Congruence • * Respect for Diversity • * Fairness • * Specificity • * Accuracy • * Universality • * Feedback for continuous improvement Collaboration has to be built into every step of data management and integrated into every data-driven decision.
“Only by evaluating both causesand effects in a comprehensive accountability system can leaders, teachers, and policymakers understand the complexities of student achievement and the efficacy of teaching and leadership practices.” Reeves, 2006 Reeves, 2006
Effect data: Outcomes or results Cause data: Professional practices that create specific effects or results Definitions and Examples
DMR Six-Step Process Inquiry:DevelopQuestions Step 2: Step 1: Conduct a Treasure Hunt Analyze Data to Prioritize Needs Step 6: Step 3: Monitor and Evaluate Results EstablishSMARTGoals Step 5: Step 4: Determine Results Indicators Select Specific Strategies
Step 1: Conduct a Treasure Hunt Why? To gather and organize data in order to gain insights about teaching, learning, and leadership practices. • Considerations: • Measures of Data • Disaggregation • Triangulation • Reflection
Measures of Data can include: StudentPerformanceData BehaviorData MeasuresofData SchoolProcessData Well-BeingData DemographicData PerceptionData
Disaggregation • To separate something into its component parts, or break apart “Disaggregation is not a problem-solving strategy. It is a problem-finding strategy.” - Victoria Bernhardt, Data Analysis for Comprehensive SchoolwideImprovement 1998
Example of Step 1 (The Treasure Hunt): School: AnytownMiddleContentArea:Writing Assessment Data: Grade 8GA WritingData, ItemAnalysis,andSchool/DistrictAssessment Subskill(s): WritingProcess
Triangulation Triangulation is a process that allows you to view achievement results with different lenses and provides a more comprehensive picture of teaching, learning, and leadership. Triangulation can be applied to the data-driven decision-making process by examining the interaction of antecedent data, collaboration data, and accountability data. Each set lends itself to trend tracking and pattern identification. In broad terms, triangulation is a method of extrapolating meaning from raw data – a way to find the critical information, see the big picture, and identify key components (angles). In education, triangulation describes efforts to determine needs or targets from diverse types of data.(Stephen H. White, Beyond the Numbers, 2011, pgs. 103-108).
Triangulation Example: • GA Grade 8 Writing Assmt.Strong increase in scores ‘12 to ‘13 but significant performance gaps btw. Caucasian, Afr. Am., & Hispanic • All students stronger on conventions – 74.5% proficient • Organization – all students 53.3% proficient • Students’ Writing PortfoliosShow frequent drafts with revisions for mechanics, conventions, etc. • Show student multiple idea development drafts/feedbackShow less evidence of proofreading and editing • School’s Mock Writing Prompt90% of students proficient in writing • 85% of students proficient in selected Organization • Significant performance gaps when compared to PASS results
Step 2: Analyze Data to Prioritize Needs Why? To identify causes for celebration and to identify areas of concern • Considerations: • Strengths • Needs • Performance behavior • Inference
Step 3: Establish SMART Goals Why? To identify your most critical goals for student achievement based on the challenges that were identified throughout the inquiry process. • Criteria: • Specific (What exactly will we measure?) • Measurable (How will we measure it?) • Achievable (Is this a reasonable goal?) • Relevant (Are goals aligned with the CIP?) • Timely (Does each goal have a defined timeframe?)
Example of Step 3 (Establish SMART Goals): Goal 1 Percentage of ________________________ scoring proficient or higher in _________________ will increase from ____________ to _____________ by the end of the ____________ school year as measured by _________________________ administered in ___________________. Organization Grade 8 students 53% 68% 2013 - 2014 GA Grade 8 Writing Assmt. Feb 2014 Goal 2 Percentage of ________________________ scoring proficient or higher in _________________ will increase from ____________ to _____________ by the end of the ____________ school year as measured by _________________________ administered in ___________________.
Step 4: Select Specific Strategies Why? Adult Actions will impact student achievement • Considerations: • Instructional Strategies • Organizational Strategies • Leadership Strategies • Programmatic Strategies • Strategies are: • Action-oriented • Measurable • Specific • Research-based
Step 5: Determine Results Indicators Why? To monitor the degree of implementation and evaluate the effectiveness of the strategies. • Considerations: • Serve as an interim measurement • Used to determine effective implementation of a strategy • Used to determine if strategy is having the desired impact • Used to help determine midcourse corrections
Step 6: Monitor and Evaluate Results Why? To engage in a continuous improvement cycle that: • Identifies midcourse corrections where needed • Adjusts strategies to ensure fidelity of implementation
Additional Support: Data Teams Refresher Courses will be offered during the 2013-14 SY. Check MyPLC for updates and to register. • Always Feel free to Contact your Regional Data Analystsin the department of Research & Evaluation for School Improvement: • East Region – Stacey L. Johnson (johnsonsl@atlanta.k12.ga.us) • West Region – Curtis L. Grier (clgrier@atlanta.k12.ga.us) • South Region – Adrienne T. Johnson (adtjohnson@atlanta.k12.ga.us) • North Region – Holly Hayes-Morrisey (hmorrisey@atlanta.k12.ga.us) • CLL – Adam Churney (achurney@atlanta.k12.ga.us)