Download

1 / 7
70 likes | 181 Views
The Economic Consequences of Emigration. Potential Positive Effects. A. Gains to the emigrant. 1. Some examples of potential migrant returns--per capita GDP differences. United States-Mexico: $47,123/ $14,266 (3.3)

E N D
Potential Positive Effects A. Gains to the emigrant. 1. Some examples of potential migrant returns--per capita GDP differences. United States-Mexico: $47,123/ $14,266 (3.3) United States-Philippines: 47,123/ 3,725 (12.7) United States-India: 47,123/3,290 (14.3) United States-Honduras: 47,123/4,404 (10.7) United States-Pakistan: 47,123/2,789 (16.9) United States-Haiti: 47,123/1,121 (42.0) United States-Canada: 47,123/39,033 (1.2) United States-United Kingdom: 47,123/35,053 (1.3) Note: Many African countries have figures below $1,000. (These are IMF PPP figures for 2010.) 2. Empirical results that show the responses to income differences. B. Higher wages in the occupations from which the emigrants are drawn.
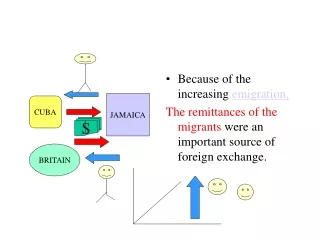
C. Higher wages for occupational categories of labor that are substitutes for emigrant labor. D. Lower unemployment in the occupations from which the emigrants are drawn. E. Remittance income. 1. Higher aggregate demand in origin countries. Estimated remittance income for Mexico: $26.1b (2007); $21.2b (2009) India: $55.1b (2009) Philippines: $17.3b (2009) China: $40.5b (2008) Pakistan: $8.7b (2009) (source: World Bank) 2. Greater savings. 3. At the micro level, improved family income, consumption, housing. 4. At the micro level, greater financial capital for investment purposes.
F. Greater human capital of returnees. 1. Skills and know-how. 2. Education. 3. Perhaps newly acquired language skills. G. Physical capital brought by returnees. H. Lower income variability for emigrant households. I. Higher GDP.
Potential Negative Effects A. Lower wages for occupational categories of labor that are complements to emigrant labor. B. Higher unemployment for occupational categories of labor that are complements to emigrant labor. C. Higher consumer prices in labor-intensive sectors from which the emigrants are drawn. D. Loss of human capital and the complementarities that human capital brings to a nation. E. Lost taxes on the higher income made possible by public investment in education.
F. Loss of physical capital that the migrants take with them. G. Decline in aggregate demand. H. Diseconomies of scale in production in the firms/industries from which the migrants are drawn. I. Lower national employment and GDP. J. Possible acquisition of “bad habits” learned in the destination by returning migrants.
Ambiguous Effects A. Higher/lower labor force participation of emigrant family members who remain behind. B. Lower labor force participation among emigrant family members who remain behind. C. Ease of migration for potential future migrants. D. The effects of changes in the income distribution.