Download

1 / 25
250 likes | 382 Views
Anchorage Giving Grades in a Formative Assessment System. March 19,2010. Research on Formative Assessment. Feedback results in achievement gains Positive vs. negative Information vs. non-content (praise, punishment)

E N D
AnchorageGiving Grades in a Formative Assessment System March 19,2010
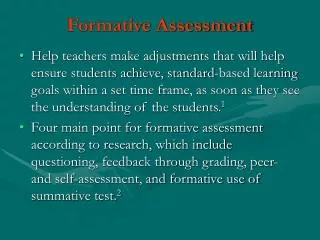
Research on Formative Assessment • Feedback results in achievement gains • Positive vs. negative • Information vs. non-content (praise, punishment) • Type of feedback – lowest gains – right vs. wrong; highest gains based on criteria (scale) • The most common form of feedback is assessment • Increased frequency of assessment results in increased achievement gain Summary: to improve achievement • Provide positive feedback • Provide feedback based on what the students knows or is able to do • Provide feedback based on a set of criteria or scales • Provide lots of feedback! Assess frequently
You can never rely on a single assessment! The reliability of a typical classroom assessment varies from .45 to .75 SD = 12 points
Gathering Formative Data • Teachers use scales to assess students on a number of Measurement Topics per unit • Data is collected from a variety of sources and recorded for each topic • Student Progress is tracked over time • Students can track their own progress
Averaging vs. the Learning Trend or Power Law of Student Learning • Traditional grading systems use a measure of central tendency, typically the mean, to determine a score. • The Learning Trend or Power Law use a student’s scores on various assessments over time to determine a student’s current level of understanding of a given topic
Why not average formative data? • Averaging assumes no learning has taken place between or among the assessments • Assumes the content on respective assessments is completely different • Tends to include lots of data points that don’t measure student knowledge • Averaging tends to hide what the student does really well, and what the student still needs to work on
The Power law • The power law can be applied to come up with a more accurate estimation of a student’s true score • Power law estimations are typically far closer to a student’s observed score than averaged scores • The power law is a mathematical function that takes into account the number of assessments, the score on each assessment and the time between assessments to calculate an estimated ‘true’ score • y=atb where y is a score on a particular assessment, t is the time at which the assessment was administered and a and b are constants
Power Law Observed Score 1 1 1.5 1.5 2 1.5 3 3 2.5 Learning Trend = 2.21 2.21 2.08 2 Average Score = 1.64 1.94 1.78 1.55 1.5 Mode = 1.5 1.24 1 .71 .5 0 Pre-Test Score 2 Score 3 Score 4 Score 5 Score 6 Post-Test
The Learning Trend • Imagine that a student has received the following scores on a measurement topic: • 1.0, 1.0, 1.5, 1.5, 2.0, 1.5, 3.0 • What summative score would they receive? • In your professional judgment – • Do they deserve a 3.0? Why or why not? • Do they deserve a 2.0? Why or why not? • Considerations: Look at the trend in the data – is it going up? Have they demonstrated consistent success at any level? Do you believe they can accomplish a specific level? Do you need more data? • What would it be averaged?
In your professional judgment – • What summative score has each student learned? • Considerations: • Look at the trend in the data – is it going up? Down? • Have they demonstrated consistent success at any level? • Do you believe they can accomplish a specific level? • Do you need more data?
How many data points do I need? • The rubrics are designed so that a teacher can use fewer data points based on a set criteria to estimate the “true score” • The short answer is that you need as many as it takes to get a good picture - using professional judgment, assessment data, and your knowledge of the student - of what a student knows at any given period of time • 4- 5 are ideal. The less certain you are about a student’s “true score”, the more data you need
Implications • Zeros given on an assignment or assessment because the student did not do it skew the calculation of a true score • If you are trying to measure what a student knows and is able to do, use other means to measure and report work completion, behavior etc. • A separate set of rubrics, or a separate grade can be used
Reporting student progress • Report summative scores for each of the topics studied in the reporting period • Reporting where a student started and finished gives one more piece of information – the “growth” • Summative scores from each topic can be combined to give an overall grade for the course/subject
Averaging Across Topics • Up until now, averaging (the mean) has been a bad word! • However, when scores are aggregated across topics or learning goals – to come up with a “grade” – the mean is a viable option • Anything done to summarize the topic specific data across topics is arbitrary, and there are no right or wrong answers! • The mean is a “compensatory” approach – one good score compensates for one bad score
Unweighted vs. Weighted • Unweighted average – all learning goals or topics are treated equally • Weighted Average – some topics or learning goals receive more “weight” than others • When weights are used, multiply the scale score times the weight… • Add all of them together… • And divide by the total number of weights
Once the mean is determined the numeric score can be translated into: A letter grade
Once the mean is determined the numeric score can be translated into: Words
Once the mean is determined the numeric score can be translated into: Percentages
Conjunctive • The conjunctive approach employs goal or target scores determined by the teacher for each topic • Minimum scores are established for each grade on each topic • This approach is useful when the teacher has not addressed all levels of the topic.
Conjunctive A= Goal 1: 2.0 or above Goal 2: 2.0 or above Goal 3: 3.0 or above B= Goal 1: 1.5 or above Goal 2: 1.5 or above Goal 3: 2.5 or above