Download
1 / 14
140 likes | 258 Views
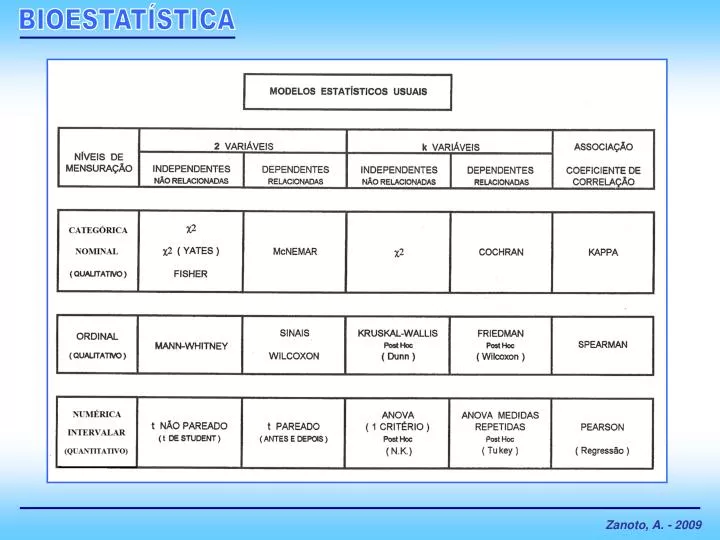
TABELAS 2 x 2 São modelos estatísticos não-paramétricos que analisam a distribuição de frequências de duas variáveis qualitativas, em que cada uma delas se apresenta em apenas 2 modalidades, mutuamente exclusivas. A forma geral dessas tabelas é a seguinte:.

E N D
TABELAS 2 x 2 São modelos estatísticos não-paramétricos que analisam a distribuição de frequências de duas variáveis qualitativas, em que cada uma delas se apresenta em apenas 2 modalidades, mutuamente exclusivas. A forma geral dessas tabelas é a seguinte:
a, b, c, d = frequências das 4 células da tabela 2 x 2 ( 2 colunas, 2 linhas ) I , II = 2 grupos ( 2 variáveis ) = A , B = 1 , 2 = X , Y , ... SIM , NÃO = 2 modalidades mutuamente exclusivas = M,F = P,A = V,M a+b , c+d = somas horizontais das frequências a+c , b+d = somas verticais das frequências N = (a+b)+(c+d) = (a+c)+(b+d) = frequência total ou grande total
Verificar se existe diferença estatística significante entre os grupos A e B e entre os grupos C e D, quanto à incidência de uma determinada doença. (Valor crítico de X2 = 3,84)