Download
1 / 36
360 likes | 573 Views
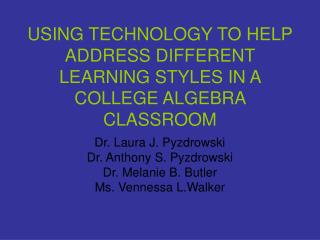
USING TECHNOLOGY TO HELP ADDRESS DIFFERENT LEARNING STYLES IN A COLLEGE ALGEBRA CLASSROOM. Dr. Laura J. Pyzdrowski Dr. Anthony S. Pyzdrowski Dr. Melanie B. Butler Ms. Vennessa L.Walker. Background. Institute for Math Learning Established at WVU in Spring 2001

E N D
USING TECHNOLOGY TO HELP ADDRESS DIFFERENT LEARNING STYLES IN A COLLEGE ALGEBRA CLASSROOM Dr. Laura J. Pyzdrowski Dr. Anthony S. Pyzdrowski Dr. Melanie B. Butler Ms. Vennessa L.Walker
Background • Institute for Math Learning Established at WVU in Spring 2001 • D, F, Withdrawal (D/F/W) rates in IML courses between 45% and 55% • In 2004, West Virginia tied for having the 5th lowest average math ACT score in the nation
College Algebra Grade Distribution Trends Fall 1998 – Fall 2000 Semester %A %B %C %D %F %W %D/F/W Fall 1998 7.3 16.9 20.4 13.9 19.8 21.7 55.5 Spring 1999 6.2 17.6 22 15.1 15.5 23.6 54.2 Fall 1999 8.7 20.2 23.2 14.4 17.7 16 48 Spring 2000 7 20.8 22.6 15 16.5 18.1 49.6 Fall 2000 12.5 20.7 19 12.8 16.5 18.4 47.7
3-Day College Algebra Grade Distributions Trends Spring 2001 - Spring 2005 Semester %A %B %C %D %F %W %DFW Spring 2001 8.1 14.1 16.2 18.9 18.9 NA NA Fall 2001 8.9 23.3 17.7 10.5 18.4 NA NA Spring 2002 8.4 18.9 18.9 15.2 12.8 25.0 53.0 Fall 2002 4.9 21.0 27.4 13.7 13.7 18.4 45.8 Spring 2003 12.1 22.1 29.5 11.7 11.7 12.8 36.2 Fall 2003 8.9 24.2 27.5 13.9 11.3 14.2 39.4 Spring 2004 7.9 23.4 23.7 16.5 13.3 15.1 45.0 Fall 2004 10.9 22.7 21.5 14.2 13.1 17.6 44.9 Spring 2005 8.2 20.1 28.6 11.6 13.5 17.9 43.1
IML Goal: D/F/W rate of 30%, From Spring 2004 and Fall 2005: Students earning a C or better in 3-day College Algebra have a 44% - 100% chance of earning a C or better in subsequent mathematics courses such as trigonometry and statistics
Why Study Learning Styles? • Butler, Pyzdrowski, Walker, and Yoho (2006 ) studied Personal Response System (PRS) use in 3-day College Algebra • In general, the results showed that students enjoyed using PRS.
Butler, Pyzdrowski, Walker, and Yoho (2006 ) • Some students thought that PRS questions were not worth the class time and there was also a discrepancy in the amount of time that students thought should be spent on PRS questions. • After analyzing student comments, the researchers began to wonder if different student learning styles could explain the range of student responses on the survey.
Personal Response System (PRS)InterWrite PRS • A combination of hardware and software that allows instructors to pose multiple choice questions. • Students use handheld wireless transmitters to answer the questions. • Software aggregates the answers and displays a chart of how many students selected each answer choice.
Learning Styles Inventory • The C.I.T.E.(Center for Innovative Teaching Experiences) Learning Styles Inventory by Babich, Burdine, Albright, and Randol was formulated at the Murdoch Teachers Center in Wichita, Kansas to help teachers determine the learning styles preferred by their students (West Virginia Department of Education, 2006)
Learning Styles Inventory • This inventory was chosen because it was readily available to the researchers through the West Virginia Department of Education and it was being used in various other projects throughout the State.
Learning Style Inventory • Comprised of 45 questions. • Students read a statement such as “When I make things for my studies, I remember what I have learned better.”, and on an scale from 1 to 4, determine if the statement is most like them or least like them.
Learning Style Inventory • Given via WebCT • Downloaded and scored in Excel • Results uploaded into WebCT • Results made available to students
Learning Style Inventory • Three primary attributes are evaluated through its use: • Information Gathering, • Work Conditions, • and Expressiveness.
Learning Style Inventory • Information Gathering sections include: • auditory language, • visual language, • auditory numerical, • visual numerical, • and auditory visual-kinesthetic combination.
Learning Style Inventory • The Work Conditions questions are used to determine if a student works better alone or in a group. • The Expressiveness questions help to determine if a student prefers oral or written communication.
Learning Style Inventory Scores on the inventory identify a student as having a major, minor or negligible style, for each of the categories.
Generalizations of Learning StylesInformation Gathering • Visual-Language • learns well from seeing words and uses information better if it has been read • Visual-Numerical • must see numbers in order to work with them • Auditory-Language • learns from hearing words spoken • An Auditory-Numerical • prefers to hear numbers and oral explanations • Auditory-Visual-Kinesthetic • learn best by experience and self-involvement
Generalizations of Learning Styles Work Conditions • Social-Individual • prefers to work alone • Social-Group • prefers to study with at least one other student.
Generalizations of Learning Styles Expressiveness • Expressive Oral • will choose to talk about what they know • Expressiveness-Written • will choose to write.
Learning StyleC.I.T.E Materials • Visual-Language: This is the student who learns well from seeing words in books, on the chalkboard, charts or workbooks. He/she may write words down that are given orally in order to learn by seeing them on paper. He or she remembers and uses information better if it has been read.
Teaching TechniquesC.I.T.E. Materials • Visual-Language: This student will benefit from a variety of books, pamphlets and written materials on several levels of difficulty. Given some time alone with a book, he or she may learn more than in class. Make sure important information has been given on paper, or that he or she takes notes if you want this student to remember specific information.
A Study Involving Learning Styles • 3-day College Algebra • Sections of 200 • Computer Laboratory Assignments • On-Line Homework Quizzes • On-Line Exams • Power Point Slides • PRS was introduced in Fall 2004 • Lecture/Study Guide in Fall 2005.
A Study Involving Learning Styles • C.I.T.E. Learning Style Inventory • Student Surveys • Retired Version of the Math ACT
A Study Involving Learning Styles • 4 sections of 3-day College Algebra • All four sections used the same syllabus, text book, and course policies. • Grades determined by participation, on-line homework quizzes, on-line exams, and laboratories • Participation points are awarded using attendance and other individual instructor input.
A Study Involving Learning Styles • Section A had approximately 192 students. Section A used PRS extensively, some PowerPoint slides, and the lecture guide. Participation Points in Section A were calculated from attendance. • Section B had approximately 200 students and Instructor B did not use PRS or PowerPoint slides during lecture. Participation Points in Section B were calculated from attendance, but students lost points if they left class early. • Section C had approximately 174 students and Instructor C used PRS, PowerPoint slides, Derive software, and the lecture guide. Participation Points in Section C were calculated from in-class activities and from attendance, but students lost points for leaving class early. • Section D had approximately 56 students Instructor D did not use PRS or PowerPoint slides. Participation Points in Section D were calculated from attendance.
Preliminary Results • Analyses were performed on the scaled math ACT scores • There was a significant main effect of math ACT, with students performing better on the posttest (M = 22.47, SD = 3.38) than on the pretest (M = 20.53, SD = 3.08). • There was no significant difference between instructors on the ACT measure.
Preliminary Results • None of the learning styles were highly correlated with each other. • This might be expected if the different styles are indeed independent of each other.
Preliminary Results Correlations of statistical significance were: • visual numerical • laboratory, quizzes, and participation • auditory linguistic • participation • auditory numerical • laboratory • kinesthetic • laboratory, quizzes and participation • individual • laboratory
Preliminary Results • Overall, 201 students returned surveys that were not blank. • Since not every section used every course component, students were asked to skip questions that did not pertain to course components used in their section.
Preliminary Results The first survey question asked students to check all of the course components that helped them understand the course material. On-Line Homework Quizzes -167 Laboratories - 116 Homework from the Text - 96 Lecture Guide - 60 PRS - 53 PowerPoint slides - 33 Reading assignments -17
Preliminary Results The second question asked students to pick the course component that helped them the most. Some students did pick more than one component. On-line Homework Quizzes -104 Homework from the Text - 34 Lecture Guide 34 Laboratories - 30.
Preliminary Results The fourth survey question asked students to check all of the course components that they thought worked well with their learning style. On-Line Homework Quizzes - 152 Laboratories - 88 Homework from the Text - 84 Lecture Guide - 53 PRS - 41 PowerPoint slides - 34 Reading Assignments - 18
Preliminary Results • Of primary interest are the survey results of Section A where the instructor had the most experience using PRS and used the lecture guide to lead the course.
Preliminary Results • In the guide, there are definitions and examples. Space is also available for extra examples. • Students are supposed to fill in the blanks and work out examples either • in class with the instructor, • working in class on their own, • or outside of class using their text. • Guide was developed to help all students including those with learning disabilities keep organized notes and identify key concepts in the course.
Results from Section A • Helpful Components • Lecture Guide - 42 • PRS - 25 • Most Helpful • Lecture Guide - 31 (accounting for over 63% of students responding) • PRS - 2 • Learning Style • Lecture Guide - 36 • PRS - 22 • Question 18 on the survey asked students if they would like to use PRS in future classes. In Section A, 36 said yes and 11 said no.
References • Average ACT Scores by State. (2004). Retrieved March 7, 2006 from http://www.act.org/news/data/04/data.html • Butler, M., Pyzdrowski, L., Walker, V. & Yoho, S. (2006). Studying personal response systems in a college algebra course. Manuscript submitted for publication. • West Virginia Department of Education. C.I.T.E. Learning Styles Instrument from WVABE Instructor Handbook, Section 3, 2003-04. Retrieved March 7, 2006 from http://wvabe.org/CITE/cite.pdf