Download
1 / 12
120 likes | 311 Views
STRONG TRUE SCORE THEORY- IRT. LECTURE 12 EPSY 625. Strong True Score Theory. Equivalent to g-theory: subject ability item difficulty Extension of true score theory Uses form of logistic regression: e Dag( - bg ) Pr(1) = 1 + e Dag( - bg ). Strong True Score Theory.

E N D
STRONG TRUE SCORE THEORY- IRT LECTURE 12 EPSY 625
Strong True Score Theory Equivalent to g-theory: subject ability item difficulty Extension of true score theory Uses form of logistic regression: eDag( - bg ) Pr(1) = 1 + eDag( - bg )
Strong True Score Theory Equivalent to g-theory: subject ability item difficulty Extension of true score theory Uses form of logistic regression: eDag( - bg ) Pr(1) = 1 + eDag( - bg )
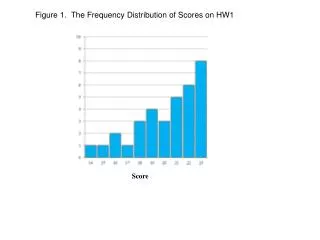
Item Response Model Probability of Correct Answer Discrimination ag 1.0 .50 0 Pg() ABILITY Assumptions: .local independence of items .single ability true score .logistic model for items: eDag( - bg ) Pr(1) = 1 + eDag( - bg ) Difficulty bg Difficulty: the ability score needed for a 50% probability of getting the item right Discrimination: slope of the IRT curve at the 50% probability intersection
MODELS • One parameter model- only bg varies across items • Two parameter model- both ag and bg vary across items
1-PARAMETER ESTIMATION • MPLUS: TITLE: this is an example of a one –parameter logistic item response theory (IRT) model DATA: FILE IS ex5.5.dat; VARIABLE: NAMES ARE u1-u5; CATEGORICAL ARE u1-u5; ANALYSIS: ESTIMATOR = MLR; MODEL: f BY u1 (1) u2 (1) u3 (1) u4 (1) u5 (1); OUTPUT: TECH1 TECH8;
MPLUS 5.5 OUTPUT Thresholds Estimates S.E. Est./S.E. F BY U1 1.000 0.000 0.000 U2 0.982 0.243 4.042 U3 0.982 0.243 4.042 U4 0.982 0.243 4.042 U5 0.982 0.243 4.042 Thresholds U1$1 -0.355 0.109 -3.256 U2$1 -0.431 0.108 -4.005 U3$1 -0.441 0.108 -4.080 U4$1 0.294 0.107 2.752 U5$1 0.459 0.108 4.256 Fixed slopes Item difficulties
2-PARAMETER ESTIMATION • MPLUS: TITLE: this is an example of a two-parameter logistic item response theory (IRT) model DATA: FILE IS ex5.5.dat; VARIABLE: NAMES ARE u1-u20; CATEGORICAL ARE u1-u20; ANALYSIS: ESTIMATOR = MLR; MODEL: f BY u1-u20; OUTPUT: TECH1 TECH8;
MPLUS 5.5 OUTPUT • Thresholds • U1$1 -0.366 0.111 -3.301 • U2$1 -0.440 0.113 -3.882 • U3$1 -0.324 0.107 -3.031 • U4$1 -0.330 0.115 -2.862 • U5$1 -0.439 0.111 -3.957 • U6$1 -0.430 0.097 -4.415 • U7$1 -0.450 0.115 -3.902 • U8$1 -0.418 0.111 -3.747 • U9$1 -0.435 0.112 -3.890 • U10$1 -0.447 0.110 -4.064 • U11$1 0.597 0.122 4.890 • U12$1 0.555 0.112 4.942 • U13$1 0.468 0.111 4.195 • U14$1 0.280 0.102 2.747 • U15$1 0.283 0.103 2.745 • U16$1 0.401 0.109 3.689 • U17$1 0.602 0.119 5.071 • U18$1 0.463 0.116 3.992 • U19$1 0.661 0.108 6.134 • U20$1 0.479 0.115 4.172 • MODEL RESULTS • Estimates S.E. Est./S.E. • F BY • U1 1.000 0.000 0.000 • U2 1.035 0.204 5.085 • U3 0.893 0.173 5.156 • U4 1.127 0.233 4.829 • U5 0.955 0.205 4.657 • U6 0.506 0.142 3.572 • U7 1.100 0.223 4.923 • U8 1.017 0.213 4.769 • U9 0.995 0.209 4.770 • U10 0.945 0.194 4.870 • U11 1.205 0.227 5.298 • U12 0.957 0.188 5.104 • U13 0.982 0.203 4.838 • U14 0.741 0.168 4.396 • U15 0.772 0.156 4.938 • U16 0.926 0.195 4.740 • U17 1.116 0.229 4.879 • U18 1.097 0.212 5.180 • U19 0.761 0.165 4.604 • U20 1.067 0.211 5.046 Slopes (a parameters) difficulties (b parameters)
Three parameter model • ag and bg vary across items • parameter cg for guessing is added: • Empirical studies indicate cg is usually lower than guessing rate • Requires 5,000 - 10,000 cases for stable estimation (ETS, ACT or NAEP samples)
Probability of Correct Answer ag 1.0 .50 0 Pg() cg bg ABILITY
MULTIDIMENSIONAL IRT - CONCEPTS AND ISSUES Pg() .5 Pg() 1 (1,2) - Difficulty in getting estimates - Inconsistent with factor model analysis