1 / 35

Barrow County Balanced scorecard

Barrow County Balanced scorecard . Overview of Strategic Objectives. Ensuring High Academic Achievement for All Students. Improvement in overall crct pass rate from 2009 to 2011. Compared to State of Georgia and other districts. Writing Score Pass Rate Trend 2008 to 2011.

erling
Download Presentation

Barrow County Balanced scorecard

An Image/Link below is provided (as is) to download presentation Download Policy: Content on the Website is provided to you AS IS for your information and personal use and may not be sold / licensed / shared on other websites without getting consent from its author. Content is provided to you AS IS for your information and personal use only. Download presentation by click this link. While downloading, if for some reason you are not able to download a presentation, the publisher may have deleted the file from their server. During download, if you can't get a presentation, the file might be deleted by the publisher.

E N D

Presentation Transcript


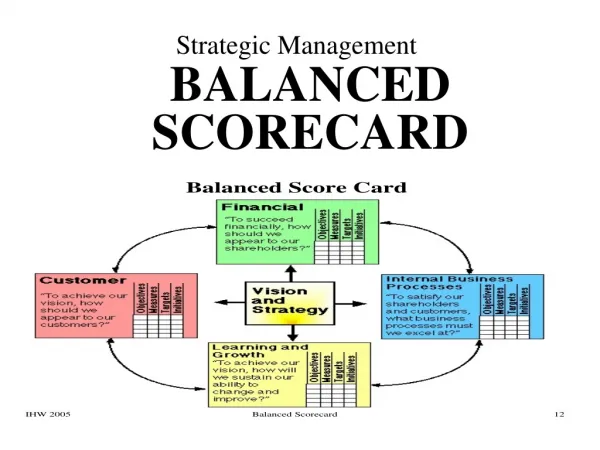
  1. Barrow County Balanced scorecard Overview of Strategic Objectives

  2. Ensuring High Academic Achievement for All Students

  3. Improvement in overall crct pass rate from 2009 to 2011

  4. Compared to State of Georgia and other districts

  5. Writing Score Pass Rate Trend 2008 to 2011

  6. If you take the number of passes/does not meet for every district in the state of Georgia on the 5th, 8th, and 11th Grade Writing Tests and combined them; Barrow County had the 12th highest total pass rate in the entire state.

  7. Compared to State of Georgia and other districts

  8. SAT

  9. ACT

  10. EOCT: 2011 performance was higher than 2010 in 6 of 8 subjects

  11. Barrow vs. Georgia EOCT 2011

  12. Economically disadvantaged students

  13. Special education students

  14. Graduation Rate

  15. Engaging all Stakeholders

  16. Staff attendance (includes all days missed regardless of reason)

  17. Student Attendance: Cronic Absenteeism

  18. Student Attendance: Good Attendance

  19. Absenteeism by level – barrow 2011

  20. Employee perception survey: percent of teachers “agreeing” with statement

  21. Number of Mentors

  22. Breakdown of Mentor applications

  23. Ensuring a Safe and Conducive Learning Environment

  24. Some specific performance measures

  25. 21st Century Skills Assessment: 8th Grade

  26. Percent of students in grades 6, 8, & 9-12 reporting not using illicit substances 2011

  27. Student Attitudes expressed on survey

  28. Four year trends on the health survey • Percent of students who report never having been bullied has been steadily increasing (from 82.9% in 2009 to 85.3% in 2011). • Percent of students who report “liking” school has been noticeably declining on the survey; from 81.1% in 2008 to 77.2% this year. • Responses to illicit substances categories report a slight trend towards more marijuana and tobacco usage.

  29. Insider vs. Outsider perspective

  30. QAT: Student Engagement by Level

  31. Bloom’s by level from QAT

  32. QAT: Differentiation

  33. And Now the Work Begins…Again

More Related