Download
1 / 2
20 likes | 98 Views
Effect of Pre-Patterning on Self-Assembly of Nanostructures Vidvuds Ozolins (University of California-Los Angeles ) DMR 0427638.

E N D
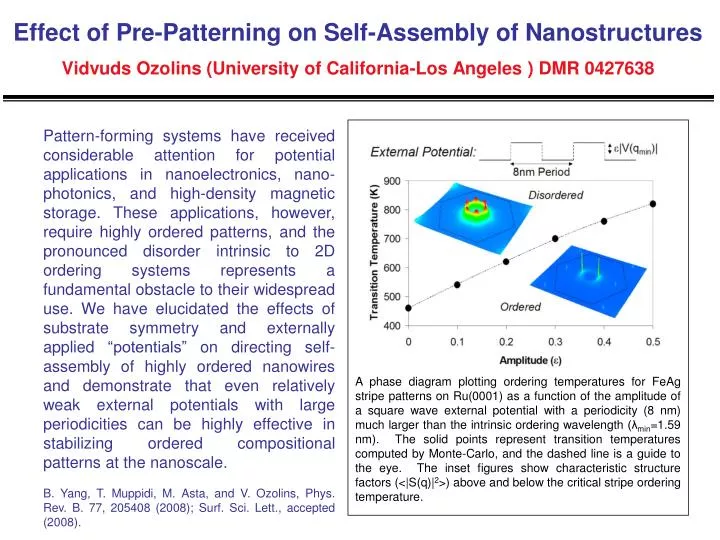
Effect of Pre-Patterning on Self-Assembly of NanostructuresVidvuds Ozolins (University of California-Los Angeles) DMR 0427638 Pattern-forming systems have received considerable attention for potential applications in nanoelectronics, nano-photonics, and high-density magnetic storage. These applications, however, require highly ordered patterns, and the pronounced disorder intrinsic to 2D ordering systems represents a fundamental obstacle to their widespread use. We have elucidated the effects of substrate symmetry and externally applied “potentials” on directing self-assembly of highly ordered nanowires and demonstrate that even relatively weak external potentials with large periodicities can be highly effective in stabilizing ordered compositional patterns at the nanoscale. B. Yang, T. Muppidi, M. Asta, and V. Ozolins, Phys. Rev. B. 77, 205408 (2008); Surf. Sci. Lett., accepted (2008). A phase diagram plotting ordering temperatures for FeAg stripe patterns on Ru(0001) as a function of the amplitude of a square wave external potential with a periodicity (8 nm) much larger than the intrinsic ordering wavelength (λmin=1.59 nm). The solid points represent transition temperatures computed by Monte-Carlo, and the dashed line is a guide to the eye. The inset figures show characteristic structure factors (<|S(q)|2>) above and below the critical stripe ordering temperature.
Phase Diagram of Thermoelectric AgPbmSbTem+2 AlloysVidvuds Ozolins (University of California-Los Angeles) DMR 0427638 Recent measurements of an exceptionally high thermoelectric figure of merit (ZT~2 at T=800 K) in lead-antimony-silver-telluride (LAST) alloys demonstrated that these materials are promising candidates for use in thermoelectric power generation devices. The mechanism of the increase in ZT could originate from strong compositional fluctuations across the specimens and associated suppression of thermal conductivity. We theoretically predict the phase diagram of LAST alloys and demonstrate that observed nanoscale inhomogeneities are precipitates of ordered AgmSbnTem+n phases, such as AgSbTe2. S. Barabash, V. Ozolins, and C. Wolverton, Phys. Rev. Lett., submitted (2008); Phys. Rev. B., submitted (2008). Calculated coherent rocksalt-based solid-state phase diagram of AgPbmTem+2, showing the boundaries of the immiscible disordered α and β solid solution phases (circles) and the order-disorder transition temperature for the (D4/L11) ordered phase (diamonds). Also marked are the experimental melting temperatures Tm of pure bulk AgSbTe2 and PbTe. The error bars show the numerical uncertainty of our Monte Carlo simulations. All dashed lines are guides for eye.