Download
1 / 37
370 likes | 439 Views
GRIDDED MOS TECHNIQUES, STATUS, AND PLANS. Bob Glahn J. Paul Dallavalle 18 th Conference on Probability and Statistics in the Atmospheric Sciences Atlanta 2006. Definition. MOS: A statistical interpretation of model output in terms of (surface) weather

E N D
GRIDDED MOSTECHNIQUES, STATUS, AND PLANS Bob Glahn J. Paul Dallavalle 18th Conference on Probability and Statistics in the Atmospheric Sciences Atlanta 2006
Definition • MOS: A statistical interpretation of model output • in terms of (surface) weather Relates observations of a weather element to be predicted (predictand) to appropriate variables (predictors) via a statistical method
Statistical Interpretation • Statistical interpretation can be by any • method desired (e.g. , regression, • discriminant analysis, etc.) • Predictors include: • NWP model output • Initial observations (persistence) • Geoclimatic data – terrain, normals, etc. • Predominant method in NWS MOS is multiple • regression • Mathematically simple, easy to implement • Models non-linearity through predictor • transformations
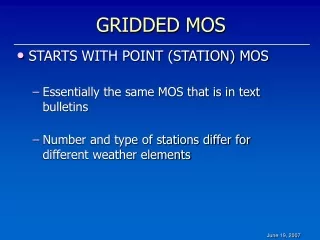
MOS Development • Uses record of observations at forecast points and model output interpolated to observation locations • Applies equations to future run of similar forecast model • Can produce probability forecasts from a single run of the underlying NWP model • Regression Estimation of Event probabilities (REEP)
NWS MOS SYSTEM • Began in 1969 with distribution of three weather elements at 79 locations over the Eastern US • First nationwide graphic product introduced in 1972 produced from 200 point Probability of Precipitation (PoP) forecasts • Grew over the years into complete packages encompassing most surface weather variables from several NMC/NCEP numerical models for all US states, Puerto Rico, and Guam for several thousand sites
MOS Text Bulletin • BALTIMORE WASHINGTON INTERNATIONAL • KBWI GFS MOS GUIDANCE 11/19/2004 1200 UTC • DT /NOV 19/NOV 20 /NOV 21 /NOV 22 • HR 18 21 00 03 06 09 12 15 18 21 00 03 06 09 12 15 18 21 00 06 12 • N/X 49 58 48 64 42 • TMP 58 57 54 52 52 52 52 54 56 56 54 53 53 52 51 58 62 61 54 48 44 • DPT 51 51 51 50 51 52 52 52 52 52 53 52 51 50 49 50 49 47 47 40 38 • CLD OV OV OV OV OV OV OV OV OV OV OV OV OV BK BK BK BK BK SC FW BK • WDR 36 06 09 09 08 09 09 11 13 13 17 00 28 29 29 31 30 30 30 31 31 • WSP 01 02 01 01 02 03 04 03 02 02 01 00 02 02 04 07 09 07 04 05 05 • P06 44 57 48 34 38 4 6 2 1 1 5 • P12 63 40 10 2 5 • Q06 1 1 1 1 1 0 0 0 0 0 0 • Q12 1 0 0 0 0 • T06 2/ 8 5/ 0 2/ 0 0/ 0 0/13 0/ 0 0/ 0 0/ 0 1/14 0/ 0 • T12 5/ 8 2/ 0 1/14 0/ 0 1/15 • POZ 0 0 0 0 0 0 0 0 0 0 0 0 0 0 0 0 0 0 0 0 0 • POS 0 0 0 0 0 0 0 0 0 0 0 0 0 0 0 0 0 0 0 0 0 • TYP R R R R R R R R R R R R R R R R R R R R R • SNW 0 0 0 • CIG 7 6 6 5 3 3 3 3 3 3 4 4 5 6 8 6 6 7 8 8 8 • VIS 6 6 6 5 5 3 3 4 5 5 5 5 5 5 2 7 7 7 7 7 7 • OBV N N N BR BR BR BR BR BR BR BR BR BR FG FG N N N N N N
Revolution • Definition: • A radical change of circumstances in a scientific, social, or industrial system • (Webster's Dictionary, 1974) • National Digital Forecast Database (NDFD) • Revolutionized the way the NWS produces • and disseminates its forecasts • Interactive Forecast Preparation System (IFPS) was enabling technology
NDFD • Definition: • A database that is a 4-dimensional representation of the weather from the current time to several days into the future -- Vertical dimension not yet well developed • Currently, the representation is on a grid of 5-km or so resolution • Built from local digital forecast databases that are updated as often as meteorological conditions warrant
Gridded MOS With the NWS mini-modernization of “going digital,” MOS guidance became needed on a grid commensurate with the resolution being used by local forecasters in producing their local grids MDL has started to produce such grids
Objectives • Produce MOS guidance on high-resolution grid (2.5 to 5 km spacing) • Provide with sufficient detail for forecast grid initialization at WFOs • Provide with a level of accuracy comparable to that of the station-oriented guidance
Gridded MOS Methods • There are two basic methods of producing Gridded MOS • Develop regression equations that can be applied at gridpoints, and directly make forecasts there • Develop regression equations that apply to observation sites (single station equations), and grid them (interpolate from quasi-random points to a regular grid)
Applying Equations to Gridpoints • Since observations for most predictands do not exist at gridpoints, a Regional Operator approach has to be used • One equation (for a weather element and projection) is developed from pooling the data (observations) in an area (Region) • Apply that equation at any and all points within that Region • Equation will not capture all the local climatology of the stations, but predictors like elevation and climatic variables help
Applying Equations to Gridpoints • Some predictands have surrogates on a grid that can be used for direct gridpoint development • Radar data for precipitation • Satellite data for clouds • Development still usually needs to be done on a regional basis
Challenges with Regional Approach • Difficult to achieve an acceptable level of accuracy • Detailed conditional climatology that can be built into single station equations is not well known at gridpoints, and has to be estimated from geoclimatic variables • Boundaries between the regions may exhibit discontinuities • Discontinuities can be eliminated by using only one Region (Generalized Operator approach) • Generalized Operator equations are even less accurate than Regional
Challenges with Single Station Approach • Objective analysis (gridding the point values) has to be able to estimate major differences of the forecast variable between the forecast data points • Such differences vary by forecast variable and are in general not known • Such differences vary by time of day, season, and synoptic situation
Diverse Observational Systems • METAR • Buoys/C-MAN • MesoWest (RAWS/SNOTEL) • NOAA cooperative observer network • RFC-supplied sites
Single Station with Gridding Approach Chosen for Temperature and Dew Point Guidance • Regional approach did not give detail needed in rugged terrain • Objective analysis with a lapse rate calculated on-the-fly gives desired detail
BCDG Analysis • Method of successive corrections • Most important distinctions from “standard” • successive correction method (currently): • Land/water gridpoints treated differently • Elevation (“lapse rate”) adjustment • Lapse rate calculated on-the-fly
Land/Water Distinction • Only land (or both) datapoints can affect land gridpoints • Each gridpoint is designated as land or water • Only water (or both) datapoints can affect water gridpoints • Each data point is designated as land or water • Some are designated as both
Land/Water Distinction • Radius of influence over water 3.5 times that over land to accommodate the sparse buoy data points • Small lakes cannot be dealt with unless there is a water datapoint close enough to influence it • Interpolation considers land/water distinction
Lapse Rate Calculated For Each Station Pre-processing step determines 60-100 neighbors for each station Lapse Rate = Sum of (temp differences of higher elevation station – lower elevation station) Divided by sum of absolute difference of elevation of the two stations • Normally the lapse rate is negative, but is sometimes positive, especially along the west coast
BCDG Analysis Options • First guess can be: • Average of all data to be analyzed • A specified constant • Some desired forecast grid, such as a grid produced from Generalized Operator Equations • Number of passes • Radius of influence by pass and first guess used • Acceptance Criteria by pass and first guess used • Buddy Check before discarding
BCDG Analysis Options (Cont.) • Mesh length per pass and first guess used • Three possible types of correction per pass and first guess used • Amount of correction for a datum based on quality of data source • Unusual lapse rates treated differently from “normal” or expected lapse rates • Amount of correction can be weighted by distance from gridpoint • Radius of influence can be limited
BCDG Analysis Options (Cont.) • Smoothing can vary by pass and first guess option used • Special “terrain-following” smoother • Smoothes over a 5- or 9-point stencil when the terrain is relatively flat. • Does not smooth a gridpoint that is at a high or low point in elevation. • Smoothes along contours when a series of three in any of 8 directions are at somewhat the same elevation
BCDG Analysis Options (Cont.) • After last pass, closest gridpoint to a datum can be set to, or nudged toward, that datum • Nudging allows a slightly closer fit to the data without creating bulls eyes when a graphic is produced • Setting to the value allows an application using the grid to almost always recover the datum
Determining the Quality of Grids of Forecasts and Guidance • Basically two ways: • Compute error statistics (e.g., MAE) at datum locations or at gridpoints • After gridding, interpolation into the grid can provide point values to compare with observations • If a suitable analysis of verifying observations exists, error statistics can be computed at gridpoints. • Viewing the graphics for meteorological content • Since graphics are many times the method of dissemination and use, this may be of as much importance as the computed error statistics.
Determining the Quality of Grids of Forecasts and Guidance (Cont.) • Withheld Data Tests • Data used in the analysis can be fit to less than one degree Fahrenheit . • Data not used in the analysis can be fit to about 3 degrees Fahrenheit . • Quality of grids • Appear to be meteorologically realistic • Fine scale detail, especially in data sparse regions, depends on the calculated lapse rates
Guidance Grids Being Produced from NCEP’s GFS Model Twice Per Day • Temperature at 3-hourly intervals • Dewpoint at 3-hourly intervals • Daytime maximum temperature • Nighttime minimum temperature
MOS Temperature Analysis (w. terrain and land/water distinction)
MOS Temperature Analysis (no terrain or land/water distinction)
Future • Expand to other weather elements and to the whole United States • Use as much mesonet data as possible • Develop BCDG to handle other weather elements • First guess and dependence on topography will vary with element • Continue evaluation and improvement • Get feedback from forecasters • NWS Western Region has begun to look at the grids