Download
1 / 18
190 likes | 331 Views
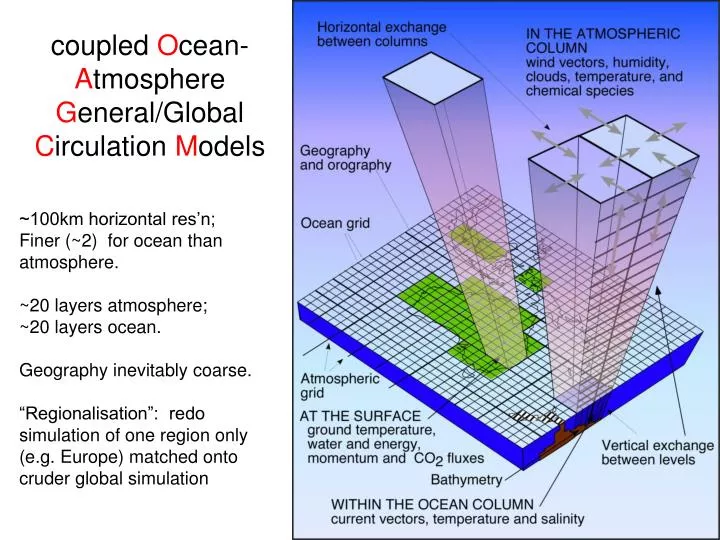
coupled O cean- A tmosphere G eneral/Global C irculation M odels. ~100km horizontal res’n; Finer (~2) for ocean than atmosphere. ~20 layers atmosphere; ~20 layers ocean. Geography inevitably coarse.

E N D
coupled Ocean-Atmosphere General/Global Circulation Models ~100km horizontal res’n; Finer (~2) for ocean than atmosphere. ~20 layers atmosphere; ~20 layers ocean. Geography inevitably coarse. “Regionalisation”: redo simulation of one region only (e.g. Europe) matched onto cruder global simulation
Features and processes Moist processes: Evaporation & condensation: clouds and latent heat Radiation processes, light and IR Sub-resolution convection -> effective viscosity & dispersion Surface changes, e.g. of albedo and roughness Atmosphere-Surface exchange: heat, vapour, liquid, momentum
<<10km: three dimensional >>10km: two dimensional Turbulence Sub-resolution convection -> effective viscosity & dispersion
Major Volcanos State of art ca 1997 -> Major volcanic eruptions are a visible and predictable perturbation on the climate.
Figure TS.23 “Greenhouse gas forcing has very likely [90%] caused most of the observed global warming over the last 50 years.” IPCC 2007 IPC 2007 ….likely [67%].. IPCC 2001
IPCC 2007 Previous predictions … correct to show wide error bars
Predictability General claim: Weather chaotic (beyond ~two weeks) but wider/longer scale climate changes relatively predicable. Evidence: Correlation of ice ages with Milankovitch cycles (of earth orbit) Successful replication of response to largest sudden terrestrial perturbations: Volcanoes El Nino changes in ocean circulation Replication of 20th climate trends Exploit: Expensive AOGCM calculations -> calibrate simpler climate simulations -> mass produce climate predictions for different future scenarios
SpecialReport on Emissions Scenarios B2 • Population peaks mid century. • A1: technology-led economy, • F fossil fuels vs ( B “balanced” ) vs T non-fossil fuelled. B1: info & service economy; sustainability & global sol’ns. • Population continues to increase. • A2: very heterogeneous world (“business as usual”) • B2: lower growth rate; emphasis on local solutions (smart but laissez-faire) not predictions, but a range of plausible assumptions
The global climate of the 21st century IPCC S/PM 2001
Figure TS.28 IPCC 2007: Scenario -> OAGCM -> Climate prediction
Figure 10.4 IPCC 2007
Observed and projected changes in extreme weather and climate events. IPCC S/PM 2001
OAGCM predictions (sample) annual mean change of the temperature (colour shading) and its range (isolines) (Unit: °C) for SRES A2 and B2 . period 2071 to 2100 relative to 1961 to 1990 B2 IPCC2001