Download
1 / 36
360 likes | 499 Views
www.cgg.cvut.cz. Problems of Visualization of Technological Processes. Pavel Slav ík , Marek Gayer, Frantisek Hrdlicka, Ondrej Kubelka Czech Technical University in Prague Czech Republic 2003 Winter Simulation Conference December 7-10 Fairmont Hotel New Orleans Louisiana, USA.

E N D
www.cgg.cvut.cz Problems of Visualization of Technological Processes Pavel Slavík , Marek Gayer, Frantisek Hrdlicka, Ondrej Kubelka Czech Technical University in Prague Czech Republic 2003 Winter Simulation Conference December 7-10 Fairmont Hotel New Orleans Louisiana, USA
Outline of the presentation • Need for visualization of dynamic phenomena • Example of a system for filter design • Dynamic phenomena and their visualization • Brief introduction to Fluid Simulators and Solvers • Our solution overview • Fluid simulator and coal particle system • Fluid Simulator State Extension (FSS) • Control of visualization dynamics • Conclusion and future work
The need for visualization of dynamic processes • Dynamic processes and understanding to their nature (e.g. in engineering education) • Classical approach: animation • Disadvantage of this approach: no interaction during the course of the process • Solution: on-line interaction with visualization module
Our approach • Development of new simulation methods that are fast enough to generate sufficient number of frames for the controlled animation • Development of new visualization methods that allow extensive control of dynamic parameters of the process visualized
Two applications • Design of flue gas filter • Combustion processes • Both cases: problems of flow dynamics • Traditional solutions: time consuming • Our solution is based on fluid simulator and particle systems • Simulations run much faster (in orders)
Active coal filter: Integral - function scheme new active coal clean gas dirty flue gas saturated active coal
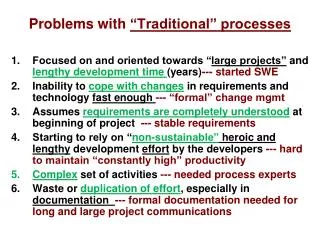
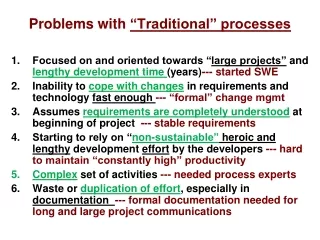
Traditional designs of filters : • Ad hoc design • Real model • Testing the real model • Modification of the real model • Testing the real model • Modification ……Very costly and the filter efficiency is often questionable
Simulation and visualization of filter behavior • Two aspects have been taken into account: • Physical behavior – behavior of granule flow • Adsorption behavior – adsorption capability of granules and its effect on gas cleaning
Verification of the model Real test Simulation of granule flow
Simulation of more complex configurations Angle of inner louvers 10° 20° 30°
Our approach to dynamic visualization • To get maximum information from the picture we can zoom its interesting parts • Visualization mantra: Overview, zoom, details-on-demand • The same approach should be used for dynamic visualization – “zoom in time” • Time segments with interesting dynamic behavior are identified and the visualization is slowed down
Future work • Model of the dynamic behavior of granules (verified) • Model of adsorption it corresponds with data acquired from filter producers Creation of proper user interface that should allow the users to dynamically influence the speed of flow of granules
Introduction and motivation to coal combustion modeling and visualization • Both for the ecological and economical reasons • Finding optimal boiler configurations • To reduce pollution • Combustion optimization • To find a way for optimal fuel preparation • How can visualization help
Traditional Fluid Simulators and Solvers • For simulation and visualization of various nature phenomena: • Water and liquids • Clouds, smoke • Fire and combustion • Special effects
Real-time modeling of fluids • Most often: solving differential equations (e.g. Navier-Stokes) • Real-time fluid simulator and solvers limitations and conditions: • Low resolution and/or 2D grid • Simplified physical models and computations • Code optimization
Our system overview • Allows dynamic, interactive overview of the combustion process • Real-time simulation and visualization (currently using 2D model simplification) • Designed on following key parts • Fluid simulator • Virtual coal particle system • Simplified combustion engine
Our Fluid Simulator • Dividing boiler area to structured grid cell arrays containing: • Velocities • Masses/Pressures • O2 concentrations • Temperatures • State update • Principle of local simulation
Virtual coal particle system • Used for both simulation and visualization of the combustion process • Virtual particle system approach • Simplified combustion and heat transfer computation
Interaction of virtual coal particles Interaction of virtual coal particles t = 0 seconds: T= 343oC(above ignition)O2 concentration = 25% Coal particle Partially burned particle C C C C C t = 0.01 seconds: T= 345oC (increased)O2 concentration= 24% Partially burnedcoal particles Coal particle transformed to burned ash particle C C B
Sample visualization of particle characteristics (particle tracks)
Storing results for real-time replaying • Results are stored on hard disk, then real-time replayed • Data sets for selected characteristics • AVI and MPEG files • Our concept:Pre-calculated Fluid Simulator States (FSS)
Extending Fluid Simulator with FSS • Simulation is divided into two phases: • Storing phase - fluid simulator states for each time step are saved on HDD • Replaying phase- simulation runs accelerated with pre-calculated fluid simulator states • Except first frame, no other data are saved (e.g. particles) • State files are stored in binary files
Feature comparison against data sets Much less disk requirements (only fluid simulator states are being saved) Lower disk bandwidth Better scalability for large grids and/or tasks with many particles Same or even better acceleration resulting in better interactivity No seeking and skip frame ability + + + + -
Conclusion and future research • Concept of Pre-calculated Fluid Simulator States offers: • Acceleration of Fluid Simulator based applications • Much less disk space & bandwidth requirements compared to using corresponding data sets • Better scalability then data sets • Future research: • Compression state data using GZIP • Testing with very large data sets • Pre-calculated Fluid Simulator States Tree
Thank you for your attention. ??? Do you have any questions ?