Download
1 / 21
220 likes | 338 Views
GIS in Biology. GIS Day 2005 Glens Falls High School. How the System Works. GIS. DATA. MAPS. REPORTS. DATA. MODELS. Layers of Data. Summit Location. Elevation Contours. Town Boundaries. DYNAMIC LINKS. Environmental Analysis. Habitat protection Species tracking

E N D
GIS in Biology GIS Day 2005 Glens Falls High School
How the System Works GIS DATA MAPS REPORTS DATA MODELS
Layers of Data Summit Location Elevation Contours Town Boundaries
Environmental Analysis • Habitat protection • Species tracking • Balanced development (e.g., “greenprinting”) • Stream and wetland buffering Society for Conservation Biology (http://www.scgis.org/index.html)
Special Ways of Viewing • Internet/Intranet • 3-D perspective
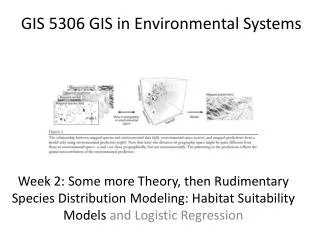
Habitat Changes over Time • Use aerial photograph with land use data • Overlay with land use data – determine if/how past land use impacts habitat • Predict, based on land use trends, future change in environment
Migration Patterns • GPS tags to track animal migration and habitat range • Example: Leatherback Sea Turtleshttp://las.pfeg.noaa.gov/TOPP_recent/sp11_trk.html
Invasive Species • Track encroachment of invasive species • Purple loosestrife • Zebra mussels
Zebra Mussel Distribution:1988-1999 1988 1999 Map Source: http://el.erdc.usace.army.mil/zebra/zmis/zmishelp/zebra_mussel_distribution.htm
Purple Loosestrife (Lythrum salicaria) Distribution in US as of April 2004 Info Source: http://www.iisgcp.org/EXOTICSP/purple_loosestrife.htm; http://ceris.purdue.edu/napis/pests/pls/imap/plsall.html
Change in Coral Reefs Interactive GIS website • Extent of reefs • Health status • Percentage decline over time • Factors contributing to decline http://www.reefbase.org/dataphotos/dat_gis.asp
Water Protection Stream protection: • Prevents soil erosion • Maintains tree cover in vicinity, keeping streams cold for species such as trout 50 foot buffer of streams Private land with harvestable timber http://www.watersheds.org/farm/marking.htm
Public Health • Spread of epidemic disease • Mapping cholera outbreak in 1854 London • H5N1 Avian Flu • Cancer incidents • Aids cases • Environmental and Cultural factors
Cholera Outbreak • Dr. John Snow maps locations of cases (tallied by thick lines on map) • Spatial patterns help identify probable cause of outbreak (i.e., contaminated water at public pump site) http://www.ph.ucla.edu/epi/snow/socbulletin34(2)3_7_2001.pdf
Identify Neighborhoods at highest risk Plan insecticide spraying West Nile Virus
Tracking Lead Poisoning in Children • Examine property data for structures built prior to 1970 • Overlay with locations of lead poisoning cases (homes of children) Map Source: http://ehp.niehs.nih.gov/members/2004/7053/fig1.jpg
Greenprinting • Land Use • Wetland Management • Mining Reclamation and Mgmt • Parks and Open Space • Transportation • Growth Management • Watershed • Case Study: Kings County, WA