Download
1 / 44
440 likes | 732 Views
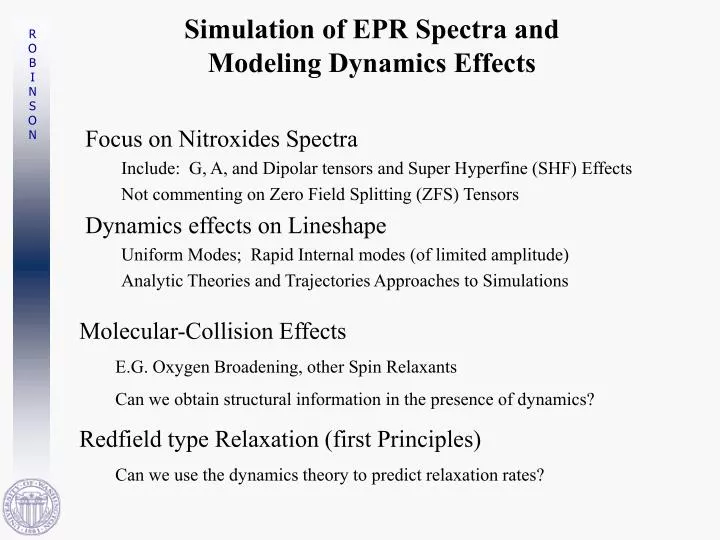
Simulation of EPR Spectra and Modeling Dynamics Effects. Focus on Nitroxides Spectra Include: G, A, and Dipolar tensors and Super Hyperfine (SHF) Effects Not commenting on Zero Field Splitting (ZFS) Tensors Dynamics effects on Lineshape

E N D
Simulation of EPR Spectra and Modeling Dynamics Effects Focus on Nitroxides Spectra Include: G, A, and Dipolar tensors and Super Hyperfine (SHF) Effects Not commenting on Zero Field Splitting (ZFS) Tensors Dynamics effects on Lineshape Uniform Modes; Rapid Internal modes (of limited amplitude) Analytic Theories and Trajectories Approaches to Simulations • Molecular-Collision Effects • E.G. Oxygen Broadening, other Spin Relaxants • Can we obtain structural information in the presence of dynamics? • Redfield type Relaxation (first Principles) • Can we use the dynamics theory to predict relaxation rates?
Spectrometer Characteristics Can we take advantage of different data types to enhance dynamics information? Obtain/Simulate Spectra at Multiple Frequencies Saturation and Saturation Transfer Techniques CW-Progressive Saturation Technique Zeeman Modulation and Over-Modulation Different Fourier Components of Spectra Harmonics with respect to Zeeman Modulation Zeeman Frequency Effects (Simplicity of Spectra in low frequency limit). Simulation of Time Domain Spectra ESE, FID, SR, pELDOR, more-complex Pulsed Experiments Generalized Global Analysis Improved methods for fitting spectra and refining the simulations
Simulation Strategies for Dynamics • What sort of theoretical approaches are there for the simulation of EPR spectra? • Analytic Methods such as MOMD (Microscopic Order; Macrosocopic Disorder) ie. Restoring Potential included in the diffusion operator. (I’m not distinguishing between transition rate method and eigenfunction expansion.) • Trajectory Methods (Uses MM or BD methods) • A combination of approximate methods with lots of uncontrolled (adjustable/floating) parameters. "Necessity is the mother of invention" is a silly proverb. "Necessity is the mother of futile dodges" is much nearer the truth. -- Alfred N. WhiteheadQuoted in W H Auden and L Kronenberger The Viking Book of Aphorisms (New York 1966).
Three Reference Spectra Three spectra that should be fit very well. The DNA does not fit well under higher power. The BSA and CTPO do not fit well as they stand now. Tensors are floated. Deutero-Msl-BSA in 60% Glycerol at 2ºC “Best” isotropic Simulation overlaid 50 mer DNA 20º C in Buffer taux,y=150ns tauz=13 ns Perdeuterated-CTPO 100% glycerol, @ -15º C; tauiso=170ns isotropic motion simulation.
Spin-Spin Interactions and Dynamics Dipolar Coupled Nitroxide Spins separated by 13Å bound to GAPDH. Use Multi-Frequency Data Improve accuracy (via error surfaces) Hustedt et al Biophys J, 74, 1997
Modulation Frequency Effects STEPR spectra of msl-Band3, with a uniaxial rotational model, rotational correlation time of ~15 microseconds Taking Advantage of modulation frequency to obtain more accurate dynamics information Hustedt & Beth Biophys J. 65, 1995
Side Chain Dynamics Using Analytic Theory with MOMD model to restrict side chain motion Sl-T4 lysozyme (at sites 44 and 69). 9 GHz 250 GHz Barnes et al Biophysical J. 76, 1999
Trajectory Simulations Theory applied to isotropic rotational motion, for a range of motional rates. Comparison of spectra from MD generated trajectories overlaid with Freed’s Analytic Theory at the same effective rotational correlation time Method Utilized also by Robinson Hustedt Levine Steinhoff & Hubbell, Biophys J. 71, 1996
Side Chain Motion from MD Simulated EPR Spectra from three positions of sl-tri-Lucine Experimental sl-BR spectra in the D-helix Steinhoff & Hubbell, Biophys J. 71, 1996
Trajectories but no simulations Trajectory simulations were performed on protein side chains of myosin light chain containing nitroxide spin labels. The order parameters were calculated and compared with the experimentally determined order parameters. LaConte et al 83, 2002
CWEPR Spectra for sl-DNAs: Pre-Averaging of Tensors Two different isotopes of spin labels. For duplex DNAs of different lengths, with the spin label uniquely in the middle of each DNA. Simulations overlaid. Semi-Analytic Method Only one adjustable parameter for each fit. Okonogi et al, Biophys J. 72, 98; 77, 99; 78, 00; PNAS 99, 02
DNA spin labeled with a different probe Using the DUTA probe of Bobst. Freed’s group simulated the spectra as a function of DNA length. Freed found two components (~90/10%). The slower component times tracked the DNA length despite the small order parameter (~0.33); smaller than previous slide (~0.95). Analytic Method (MOMD/SRS) Liang et al J. Phys. Chem. 104, 2000
EPR Spectra of Spin-Labeled TAR RNAs 3' 5' G C G 38 G C A U 25 U G C C 23 U 40 A U G C A U C G C G G C 5' G C 3' C
3' 5' G C G 38 G C A U 25 U G C C 23 U 40 A U G C A U C G C G G C 5' G C 3' C EPR of TAR RNAs in the Presence of Cations native Ca2+ Na+ Edwards, T. E., et. al. Chem. Biol. 2002, 9(6), in press
“Dynamic Signature”: from EPR Spectra Obtain “characteristic information but NO spectral Simulations. Very difficult problem: Internal Dynamics, uniform modes, differential structures, etc.
Proper Simulations should use/extract proper Rates: • Can CW give correct relaxation rates? Yes if: • Tensors are right • Super Hyperfine Interactions are correct • Dynamics are “Tractable” • Now Compare CW and TD Techniques • CW Technique is Progressive Saturation • STEPR is a CW techniques that relies on R1e • (but the rate is an ad hoc parameter) • Generally one does not simulate (partially)-saturated spectra, but it would provide more information.
TEMPOL: first harmonic Absorption Abs-Quad Center line of 14NH18 Tempol in water. Low power Dispersion Disp-Quad
TEMPOL: second harmonic Abs-Quad Absorption Center line of 14NH18 Tempol in water. Low power Disp-Quad Dispersion
From CW Fits: Super Hyperfine Structure of TEMPOL Carbon 13 lines at 1.1% Obtained directly from the perdueterated spectra. Thee relaxation rates compare favorably to the theory Spin Rotation mechanism predicts ~ 70 to 80 mG (dominant term for spin lattice relaxation). The combined END and CSA mechanisms on the center line are also around ~60 mG. The sum of these two rates (130-140mG) dominates the spin-spin relaxation time. Essential: Absorption to Dispersion Ratio and Out of Phase dispersion (1st Harmon)
FID and theory with shf and no adjustable parameters Single exponential Super Hyperfine Pattern Pattern of 3075 shf lines from Tempol protons and carbons
Are CW and TD results equivalent? Now examine the connection between R1e and R2e obtained from CW spectra and the Time Domain FID and SR spectra
FID as a function of Carrier Offset No Adjustable Parameters: Experimental Full simulation Simple SHF Pattern
Stimulated on Resonance Stimulated 0.5 Gauss off Resonance SR Signal and Simulation No adjustable Parameters in Fit, using exact (protonated TEMPOL) SHF pattern. Notice early time is not a “pure” recovery Best single exponential is 1.95 Mrads/sec, vs 1.64 in this simulation; no adjustable parameters
FID of Perdeuterated TEMPOL FID for the center 14N line of 0.25 mM 14ND17 TEMPOL in H2O at 20oC With O2 Without O2 Best single exponential –dashed lines Solid lines are fits to the product of a Gaussian and an exponential decay, no adjustable parameters.
Human Secretory Phospholipase sPLA2 A highly charged (+20 residues) lipase And a highly charged (-70 mV) membrane All exposure data was determined by SR and pELDOR directly measuring spin-lattice relaxation rates.
Reference Spectra and Spin Labeled sPLA2 Canaan et al. J. Biol. Chem. 2002 14ND13 CTPO in 85% Glycerol 14N MTSSL sl-hGIIA-sPLA2 on micelles solvent accessibility
Spin Lattice Relaxatin Rates for sl-sPLA2 rates from pSR and pELDOR for CTPO solvent accessibility
Spin Lattice Relaxation Rates Nuclear Spin Lattice Spin Rotation plus O2 Relaxant Spin Rotation Electron and Nuclear Spin Lattice Relaxation Rates for 15N model nitroxides (CTPO) in glycerol water mixtures. The 14N version gives nearly the same rates. END (A & G) tensors Electron Spin Lattice Spin Diffusion (Methyl Groups)
NaCl reduces Crox Relaxivity Increasing Relaxant [Crox]; no Salt Increasing Salt at high [Crox] Same Spectra
Comparison of TD and CW measurement of Relaxivity Relaxivity of N70 sl-sPLA2 in 50 mM Tris/HCl buffer. Theory required +25 mV potential and is a double exponential dependence on [NaCl] CW values inherently off by 25%.
Sl-DNA: CW and TD Data Saturation Recovery on low field line
O2 relaxant on sl-DNA O2 increases relaxation as it does on proteins in aqueous buffer Robert: In your fig 15, can those spectra be simulated? What about Tamara’s simulations?? 15N spin labeled 50-mer duplex DNA in 0% sucrose at 20oC Rotational Correlation time (perp)= Cannot simulate spectra accuratly
Conclusions for Discussion and the Future Many Spectrometer Frequencies (Identify anistropy and hindered motions) Don’t forget about low frequencies especially for Dynamics Using GGA with many different spectral components related by known ways (Zeeman Freq, Amplitude, Microwave Power, temperature, etc.) Use TD methods to obtain accurate relaxation parameters: A first principles Relaxation Matrix and relaxation rates. Use CW to obtain accurate SHF patterns (calibration spectra) Use Robust Dynamics Modeling methods to include the details of molecular motion.
Relaxant Method: Nitroxide Spectra depend on concentration of relaxants Rates are increased by the same amount due to additional relaxing agents (relaxants). Spin-Spin (T1 or R1 processes) Spin-Lattice (T2 or R2 processes)
Obtaining Relaxation Information • Time Domain (Saturation Recovery or Pulsed ELDOR) depends on R1, directly. • CW method (progressive saturation or rollover”) depends on P2. • Signal Height is a function of incident microwave power:
Errors of Fitting to TEMPOL data Chi Squared values for fits to TEMPOL spectra. The model completely accounts for the partially-saturating rf power
Relations among various spectral components In Low Zeeman Modulation Frequency Limit: Spectra can be interconnected The Dispersion Absorption Ratio was critical to finding right SHF model So are other components rather simply related (at low Zeeman Frequency). Modulation amplitude (over modulation) highlights the simple relations Even for out of phase (STEPR) signals. Marsh’s comments about integrated Absorption signal being modulation amplitude independent (app., depends on Mod Freq). Show an example of this.
Over Modulation Effects (I) Under STEPR conditions, h1=0.36 G, @ 62kHz Zeeman Modulation 50 mer-duplexDNA; buffer. Data: One Gauss Mod Amp; Convolution (black) of top spectrum (blue). No adjustable parameters. Data: 5 G (p/p) mod amp
Over Modulation Effects (II) Under STEPR conditions, h1=0.36 G, @ 62kHz Zeeman Modulation 50 mer-duplexDNA; buffer. Convolving first harmonic to second harmonic in phase. No adjustments for convolution, no rescaling to fit.
Over Modulation Effects (III) Under STEPR conditions, h1=0.36 G, @ 62kHz Zeeman Modulation 50 mer-duplexDNA; buffer. First Harmonic Out of Phase at 1 Gauss Zeeman, under Saturation Convolving first harmonic to second harmonic OUT of phase (black line). No adjustments for convolution, no rescaling to fit. The STEPR spectrum: Second Harmonic Out of Phase under saturation
Over Modulation (IV) Msl-BSA 60% Glycerol, 2C STEPR signal (I.e. under saturation) Second Haromonic out of phase STEPR spectra and 0.5G convolution (Black) overlaid. Convolve 0.5G to 4 G (black) and compare with experimental spectra (red).
C2 Domain of cPLA2 Stereo View looking onto the Membrane. Notice the 3 looped regions near Ca (green) ions.
C2 Domain of cPLA2 Exposure Factor to aqueous Crox, a spin relaxant for nitroxide spin labels on C2 residues. Solid line is Poisson Boltzmann theory for the exposure factor. Negative r values are into the membrane. R=0 is near the phosphate head groups of the (artificial) anionic membrane (DTPM).