Download
1 / 18
200 likes | 388 Views
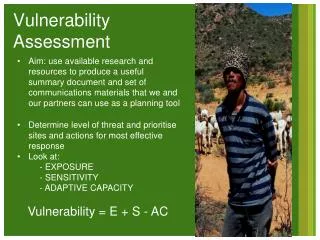
Livelihood Vulnerability and Nutritional Assessment of Rural Kassala and Red Sea State. Sudan June 2005. Main Objectives. Determine if current livelihood conditions indicate an impending crisis Assess levels of chronic structural vulnerability and poverty and malnutrition in Eastern Sudan

E N D
Livelihood Vulnerability and Nutritional Assessment of Rural Kassala and Red Sea State Sudan June 2005
Main Objectives • Determine if current livelihood conditions indicate an impending crisis • Assess levels of chronic structural vulnerability and poverty and malnutrition in Eastern Sudan • Determine current level of food deficit • Recommend food aid and non-food aid interventions
Methodology • HH livelihood survey to gain a greater understanding of livelihood systems and to quantify the depth and breadth of food insecurity and livelihood vulnerability. • Nutritional survey including anthropometric measurements of children under 5 and pregnant and/or lactating women, consumption patterns, and morbidity and mortality data.
Methodology Cont. • Qualitative survey to provide an in-depth understanding of the livelihood context for to interpret the quantitative results and to identify underlying causes of food insecurity and vulnerability.
HOUSEHOLD LIVELIHOOD SECURITY: A FRAMEWORK FOR ANALYSIS INSTITUTIONAL PROCESSES & ORGANIZATIONAL STRUCTURES CONTEXTS, CONDITIONS AND TRENDS LIVELIHOOD STRATEGIES SUTAINABLE LIVELIHOOD OUTCOMES LIVELIHOOD RESOURCES Policy Social Economic Political Environmental Infrastructure Demography Historical Nutritional Security Food Security Income Security Education Security Health Security Habitat Security Social Network Security Safety Environmental Security Life Skills Capacity Natural Capital Economic/Financial Capital Human Capital Social Capital State Formal Civil Society Informal Civil Society Private Sector Production and Income Activities Processing, Exchange and Marketing Activities Contextual analysis of conditions and trends and assessment of policy setting Analysis of institutional/organizational influences on access to livelihood resources and composition of livelihood strategy portfolio Analysis of outcomes and trade-offs Analysis of livelihood strategy portfolios and pathways Analysis of livelihood resources; trade-offs, combinations, sequences, trends Modified from Scoones, 1998
Sampling Framework • 2 states: Kassala and RSS • Nutritional survey: 30 clusters of 30 children each in both states • HH livelihood survey: 30 clusters of 15 HHs in both states • Qualitative survey: 6 villages per state - representative of each locality (12 in total)
Cluster Selection • Random selection of clusters proportional to population size. • Based on GoS census data projection. • Selected 40 clusters in each state (including 10 back up clusters).
Household Selection • Random selection of HHs upon arrival. • Identified center of the cluster and spun a pen to identify initial sampling direction. • Randomly selected first HH from direction of pen – next HH was first on the right when facing out of the HH door. • Marked HHs with numbered paper for identification by both survey teams.
Household Selection cont. • Continued until reached intended sample for each cluster: • 32 children for nutrition survey (2 back up) • 15 HHs for livelihood survey • Livelihood survey conducted interview in first 15 HHs selected.
Household Selection cont • The Livelihood survey interviewed first 15 randomly selected HHs regardless of HH composition. (914 HHs total) • The Nutrition survey completed questionnaire and anthropometric measurements for all HHs with children < 5; (1900 HHs and 1875 children under 5 total) • Anthropometrics data also collected for HHs with pregnant and/or lactating women; • Mortality data was collected for all households surveyed (1948 HH total)
Linking Data • The Livelihood and Nutrition data for all of first 15 randomly selected HHs with children < 5 were linked by cluster and HH numbers. • Total of 852 HHs linked. (i.e. nutrition information and household livelihood information collected from the same household)
Quantitative Data Analysis • Data provided livelihoods profile including HH demographics, income, production, assets , and reliance on negative coping strategies. • Data provided state-level nutritional statistics for children < 5 and pregnant and lactating women • Data identified HH livelihood factors and characteristics which were significantly related to the presence of both moderate and severe malnutrition of children < 5.
Qualitative Data Analysis • Data collected through PRA techniques including key informant interviews, interactive tools and direct observations. • Qualitative data provided in-depth understanding of local livelihood systems. • Data provided context and constraints leading to food insecurity.
Lessons Learned I • Census data was often outdated as communities had migrated or dispersed and back up clusters were utilized. This may have skewed representation at locality level. • Dispersed settlement patterns of the communities increased time required for sampling procedure.
Lessons Learned II • Difficult to avoid duplication of interview questions – basics of demographics were starting point for both Livelihood and Nutrition surveys. • Difficulty in conveying importance of random sampling - village leaders wanted sample to include members of each of multiple tribes.
Lessons Learned III • Used MoH list for causes of mortality and morbidity. Many respondents cited other as cause for mortality – actual causes of death not accurately recorded in many cases.
Survey Findings Factors with a significant relationship to the presence of malnutrition in children <5 in HH: • Literacy of head of household • High Dependency ratio • Low total household income • High Household coping strategies index
Survey Findings Cont. Factors with a significant relationship to the presence of malnutrition in children <5 in HH: • Time required to reach water source • Average amount of money spend on water per week • Main water source (unprotected) • Number of months of household food insecurity in the last year