Download
1 / 31
310 likes | 432 Views
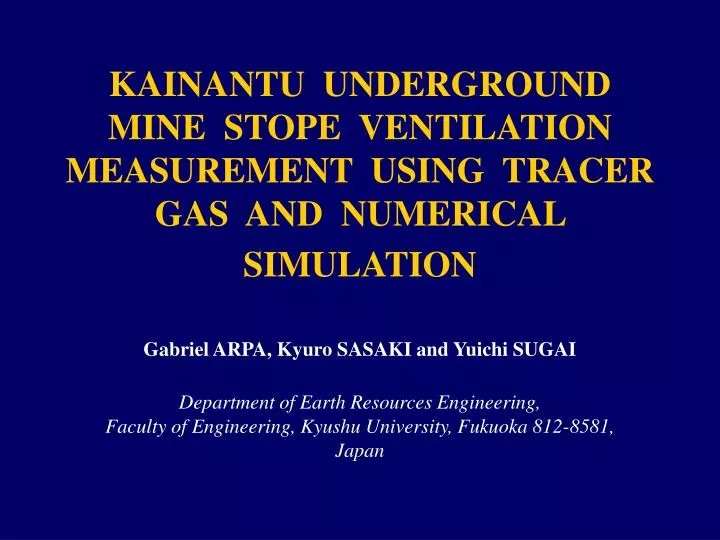
KAINANTU UNDERGROUND MINE STOPE VENTILATION MEASUREMENT USING TRACER GAS AND NUMERICAL SIMULATION. Gabriel ARPA, Kyuro SASAKI and Yuichi SUGAI Department of Earth Resources Engineering, Faculty of Engineering, Kyushu University, Fukuoka 812-8581, Japan. BACKGROUND.

E N D
KAINANTU UNDERGROUND MINE STOPE VENTILATION MEASUREMENT USING TRACER GAS AND NUMERICAL SIMULATION Gabriel ARPA, Kyuro SASAKI and Yuichi SUGAI Department of Earth Resources Engineering,Faculty of Engineering, Kyushu University, Fukuoka 812-8581, Japan
BACKGROUND Continuous research into improving airflow quality and quantity is an on going activity. Tracer gas can be an effective method to assess mine ventilation system. Tracer gas can be used to: Determine complex airflow patterns and flow volume, where velocity is too low, openings too large, or cross section geometry too complex. Accurate determination of ventilation assessment parameters; Re-circulations, - Leakages, -residence time Simulate and model the spread of contaminants. Tracer gas can give effective information of airflow in highly irregular airflow paths and can be an effective method to assess mine ventilation system and airflow dynamics.
2. Check for possible short cuts /leakages (Widodo et al. 2006) 3. Flow dynamics along airway routes. (Taylor et al. 1953, Sasaki et al. 2002, Widodo et al. 2006) REVIEW 1.Check for air Leakage. (Hardcastle et al. 1993) However, there is little research on shorter mine airways and mine face, and the effect of dead ends and open spaces along airway routes.
OBJECTIVE To Study: Airflow through narrow vein shrinkage stope by using tracer gas technique and numerical simulation. The effect of dead end drives, openings and empty spaces along the airway route on airflow quantity and quality. METHOD By pulse injection of SF6 from upstream positions and measure the concentration with elapsed time at a downstream position.
RESEARCH APPROACH Ventilation Survey Tracer Gas Measurement Numerical Simulation
FIELD MEASUREMENT The Kainantu Mine
KAINANTU MINE OVERVIEW Mining Method: Narrow Vein Shrinkage stope Production: 300 ton ore/day Semi-mechanized operation
MINE VENTILATION Ascension – Through flow system Fan 3 Fan 2 Fan 1 4th Outlet Main intake (1300 Portal) Schematic of ventilation system
Monitor Lap top Sampling Upper level Raise Pulse release of SF6 Lower level MEASUREMENT SYSTEM Gas Monitor system Lap top Stop watch Portable scale Balloons Sulfur hexafluoride (SF6) Photoacoustic gas monitor (Brual & Kjear 1302) Resolution = 10 ppb Absolute accuracy = +/- 50 ppb Sampling rate = 40 sec Not to scale
MEASUREMENT PROCEDURE SF6 monitoring point Level 19 Raise 2 Raise 1 (No break through) 30 m SF6 Release point. Broken ore 25 m Level 20 40 m 30 m SF6 measurement point Level 19 Raise 1 Raise 2 SF6 Release point. 30 m Broken ore 15 m Level 20 30 m 70 m Drives 3 m 4 m Raises 1 m 1 m SF6 release and measurement stope 20L20R ( Shrinkage stope) SF6 release and measurement stope 20L24R ( Shrinkage stope)
NUMERICAL SIMULATION (Sasaki & Dindiwe, 2002) Where: Cigas concentration at a downstream node Ci-1 gas concentration at an upstream node t elapsed time from gas injection Qiair flow rate on an airway τ time interval A cross sectional area of an airway Exeffective turbulent diffusion coefficient in flow direction X distance between two nodes and ν average gas convection velocity in an airway Downstream Ci Upstream Ci-1 Airflow
Additional Route Route 1 Conc. Time EFFECT OF DEAD SPACES & OPENING ON AIRLOW Airways with dead spaces Airways without dead spaces Conc. Time
RESULTS SF6 monitoring point Level 19 Raise 2 Raise 1 (No break through) 30 m SF6 Releasepoint. 6.3 m3/min Broken ore 25 m Level 20 40 m 30 m Level Raise Av. Velo.(m/s) 0.2-0.4 1-1.3 54 m3/min 31 m3/min Level 20 SF6 release and measurement stope 20L20R ( Shrinkage stope)
RESULTS 40.5 m3/min 27 m3/min 3.5 m3/min SF6 measurement point Level 19 Raise 1 Raise 2 SF6 Release point. 30 m Level Raise Broken ore 15 m Av. Velo.(m/s) 0.2-0.4 1-1.3 Level 20 30 m 70 m 30 m 70 m SF6 release and measurement stope 20L24R ( Shrinkage stope)
RESULTS 34.5 m3/min 26 m3/min 2.5 m3/min SF6 measurement point Level 19 Raise 1 Raise 2 SF6 Release point. 30 m Level Raise Broken ore 15 m Av. Velo.(m/s) 0.2-0.4 1-1.3 Level 20 30 m 30 m SF6 release and measurement stope 19L16R ( Shrinkage stope)
RESULTS One Raise Open Both Raise Open Better air flow in the stope with one raised, then the stopes with both raises open.
DISCUSSION and CONCLUSION Better understanding of airflow routes can be achieved by studying the arrival times and the peak of the concentration time curve for the various routes simulated. Airflow rates of the stopes were evaluated with matching measured concentration-time curves with numerical ones by a numerical diffusion model in considering diffusion in open and empty spaces Most importantly, an additional airway branch was constructed. The additional branch in the numerical model has a much longer airway length and an increased cross-sectional area with low air flow velocity.The new method has greatly improved the tailing effect . Therefore it can be concluded that openings, dead end drives and other open spaces have no relation on flow rates, but affect the airflow quality provided from the inlet portal
END OF PRESENTATION!!! THANK YOU VERY MUCH FOR YOUR KIND ATTENTION!!!!!!!!!!
RESULTS SF6 monitoring point Level 19 Raise 2 Raise 1 (No break through) 30 m SF6 Releasepoint. Broken ore 25 m Level 20 40 m 30 m Additional airflow route to simulate for open spaces, dead end drive, voids etc.. Schematic of airflow. A) Plan of 20 level, B) Arrangement of additional branch (Route 3) SF6 release and measurement stope 20L20R ( Shrinkage stope)
RESULTS SF6 measurement point Level 19 Raise 1 Raise 2 SF6 Release point. 30 m Broken ore 15 m Level 20 30 m 70 m Additional airflow route to simulate for open spaces, dead end drive, voids etc.. Schematic of airflow. A) Plan of 20 level, B) Arrangement of additional branch (Route 3) 30 m 70 m SF6 release and measurement stope 20L24R ( Shrinkage stope)
RESULTS SF6 measurement point Level 18 Raise 1 Raise 2 SF6 Release point. 30 m Broken ore 15 m Level 19 30 m 30 m Additional airflow route to simulate for open spaces, dead end drive, voids etc.. Schematic of airflow. A) Plan of 20 level, B) Arrangement of additional branch (Route 3) 30 m 70 m SF6 release and measurement stope 19L16R ( Shrinkage stope)
Stope 20L20R Stope 20L24R
Most importantly, improvement has been made at the tailing effect between the simulation and tracer gas measurement by reconstructing an additional branch to represent the delayed arrival of air due to the open spaces along the airways. The additional branch in the numerical model has a much longer airway length and an increased cross-sectional area with low air flow velocity. Therefore it can be concluded that openings, dead end drives and other open spaces have no relation on flow rates, but affect the airflow quality provided from the inlet portal.
SF6 monitoring point Level 19 Raise 2 Raise 1 (No break through) 30 m SF6 Releasepoint. Broken ore 25 m Level 20 40 m 30 m
SF6 measurement point Level 19 Raise 1 Raise 2 SF6 Release point. 30 m Broken ore 15 m Level 20 30 m 70 m
SF6 measurement point Level 19 Raise 1 Raise 2 SF6 Release point. 30 m Broken ore 15 m Level 20 30 m 70 m
Taylor’s et al., 1953 & 1954 Where: C(x,t) gas concentration at a downstream VVolume of gas released t elapsed time from gas injection Across sectional area of an airway D Virtual diffusion coefficient in flow direction X distance between two nodes and u average uniform flow velocity of the airway
Best Matching & Tailing Effect Airways with dead spaces Between Measured & Simulated Airways without dead spaces Additional Route Conc. Measured Measured Simulated Simulated Route 1 Time route 1 Simulated Conc. additional route Tailing Effect Time
VENTILATION NETWORK 19L16R 20L20R 20L24R Construction of entire ventilation network using Mine ventilation simulator, MIVENA Ver.6 (Sasaki & Dindiwe, 2002) Kainantu ventilation network (MIVENA) Datadase window Analysis window Kainantu ventilation layout
Normal Leak