Download

1 / 7
70 likes | 159 Views
Learn about the study conducted by Mahendra Trivedi to check impact of biofield energy on physicochemical and spectroscopic properties of protose.<br>

E N D
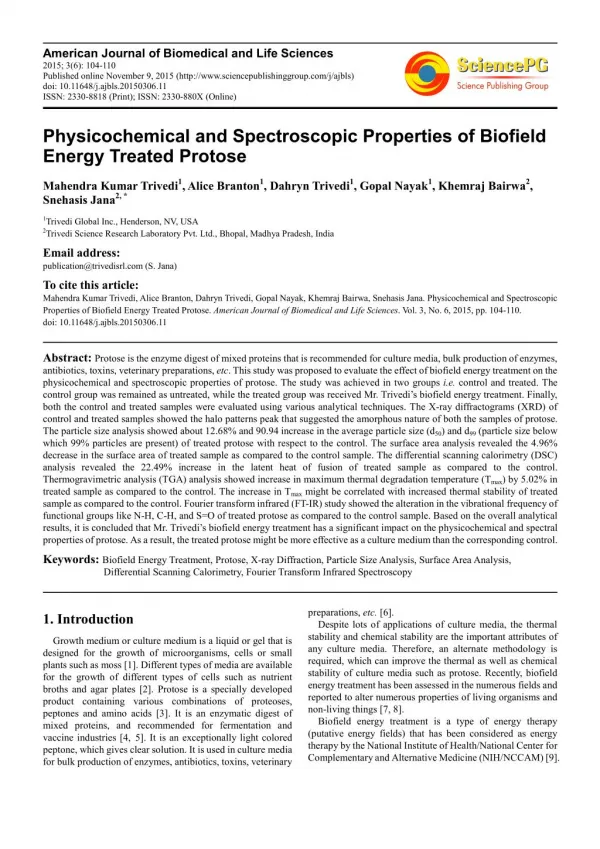
American Journal of Biomedical and Life Sciences 2015; 3(6): 104-110 Published online November 9, 2015 (http://www.sciencepublishinggroup.com/j/ajbls) doi: 10.11648/j.ajbls.20150306.11 ISSN: 2330-8818 (Print); ISSN: 2330-880X (Online) Physicochemical and Spectroscopic Properties of Biofield Energy Treated Protose Mahendra Kumar Trivedi1, Alice Branton1, Dahryn Trivedi1, Gopal Nayak1, Khemraj Bairwa2, Snehasis Jana2, * 1Trivedi Global Inc., Henderson, NV, USA 2Trivedi Science Research Laboratory Pvt. Ltd., Bhopal, Madhya Pradesh, India Email address: publication@trivedisrl.com (S. Jana) To cite this article: Mahendra Kumar Trivedi, Alice Branton, Dahryn Trivedi, Gopal Nayak, Khemraj Bairwa, Snehasis Jana. Physicochemical and Spectroscopic Properties of Biofield Energy Treated Protose. American Journal of Biomedical and Life Sciences. Vol. 3, No. 6, 2015, pp. 104-110. doi: 10.11648/j.ajbls.20150306.11 Abstract: Protose is the enzyme digest of mixed proteins that is recommended for culture media, bulk production of enzymes, antibiotics, toxins, veterinary preparations, etc. This study was proposed to evaluate the effect of biofield energy treatment on the physicochemical and spectroscopic properties of protose. The study was achieved in two groups i.e. control and treated. The control group was remained as untreated, while the treated group was received Mr. Trivedi’s biofield energy treatment. Finally, both the control and treated samples were evaluated using various analytical techniques. The X-ray diffractograms (XRD) of control and treated samples showed the halo patterns peak that suggested the amorphous nature of both the samples of protose. The particle size analysis showed about 12.68% and 90.94 increase in the average particle size (d50) and d99 (particle size below which 99% particles are present) of treated protose with respect to the control. The surface area analysis revealed the 4.96% decrease in the surface area of treated sample as compared to the control sample. The differential scanning calorimetry (DSC) analysis revealed the 22.49% increase in the latent heat of fusion of treated sample as compared to the control. Thermogravimetric analysis (TGA) analysis showed increase in maximum thermal degradation temperature (Tmax) by 5.02% in treated sample as compared to the control. The increase in Tmax might be correlated with increased thermal stability of treated sample as compared to the control. Fourier transform infrared (FT-IR) study showed the alteration in the vibrational frequency of functional groups like N-H, C-H, and S=O of treated protose as compared to the control sample. Based on the overall analytical results, it is concluded that Mr. Trivedi’s biofield energy treatment has a significant impact on the physicochemical and spectral properties of protose. As a result, the treated protose might be more effective as a culture medium than the corresponding control. Keywords: Biofield Energy Treatment, Protose, X-ray Diffraction, Particle Size Analysis, Surface Area Analysis, Differential Scanning Calorimetry, Fourier Transform Infrared Spectroscopy preparations, etc. [6]. Despite lots of applications of culture media, the thermal stability and chemical stability are the important attributes of any culture media. Therefore, an alternate methodology is required, which can improve the thermal as well as chemical stability of culture media such as protose. Recently, biofield energy treatment has been assessed in the numerous fields and reported to alter numerous properties of living organisms and non-living things [7, 8]. Biofield energy treatment is a type of energy therapy (putative energy fields) that has been considered as energy therapy by the National Institute of Health/National Center for Complementary and Alternative Medicine (NIH/NCCAM) [9]. 1. Introduction Growth medium or culture medium is a liquid or gel that is designed for the growth of microorganisms, cells or small plants such as moss [1]. Different types of media are available for the growth of different types of cells such as nutrient broths and agar plates [2]. Protose is a specially developed product containing various combinations of proteoses, peptones and amino acids [3]. It is an enzymatic digest of mixed proteins, and recommended for fermentation and vaccine industries [4, 5]. It is an exceptionally light colored peptone, which gives clear solution. It is used in culture media for bulk production of enzymes, antibiotics, toxins, veterinary
105 Mahendra Kumar Trivedi et al.: Physicochemical and Spectroscopic Properties of Biofield Energy Treated Protose The bio-electromagnetic therapy, healing touch, etc. and comprise low-level of energy field exchanges [10]. The human body has the unique bioenergetics field that consists of energy structures such as biophotons [11]. The biophoton is non-thermal origin in the UV-visible spectrum, emitted from a biological system. These biophotons contain informations that regulate all the system of human body in order to communicate and work coherently [12]. This is generally observed in the healthy condition of human body. However, these biophotons are disordered in diseased conditions; resulting in communication problems among cells, organs, and energy systems [13]. For instance, the cancer cells are discordant with the rest of cells of body, which result in uncontrolled growth and lead to endanger the survival of the body [14]. The practitioners or specialists of energy medicine modulate and balance this bioenergetic field via harnessing the energy from the Universe [15]. Hence, the biofield energy treatment is the practice wherein the human harness the energy from environment and transmit it to any living or nonliving object on the Globe. Mr. Mahendra Kumar Trivedi possesses a unique biofield energy; and his biofield energy treatment is known as The Trivedi Effect®. Recently, Mr. Trivedi’s biofield energy treatment is reported to improve the growth of plants and quality and quantity of plant products like blueberry, ginseng, tomato, etc. [16, 17]. Moreover, the contents of chlorophyll (a and b) were also found increased after the biofield energy treatment with respect to the control [18]. The biofield treatment has also modified the spectral and physicochemical properties of organic products such as beef extract and meat infusion powder [19]. Hence, considering the impact of biofield energy treatment, this study was aimed to evaluate the effect of biofield treatment on the protose using various analytical techniques. energy therapies include magnet therapy, was done on Phillips (Holland PW 1710) X-ray diffractometer. The system was equipped with nickel filter and copper anode, the wavelength was set to 1.54056Å. 2.3. Particle Size Analysis The particle size of control and treated protose was determined using laser particle size analyzer (Sympatec HELOS-BF) at the detection range of 0.1–875 µm. The particle size data were obtained in the form of a chart of particle size vs. cumulative percentage. The average particle sizes d50 was deduced using particle size distribution curve. The percent change in average particle size was calculated using following equation. % change in particle size,d?? =??d??? ???????− ?d??? ? !?? "# ?d??? ? !?? " × 100 Where, (d50) Control and (d50) Treated are the average particle size of control and treated samples, respectively; similarly the d99 was calculated. 2.4. Surface Area Analysis The surface area of control and treated protose was analyzed based on the ASTM D 5604 method using the Brunauer–Emmett–Teller (BET) surface area analyzer (Smart SORB 90). The instrument range was set to 0.2 m2/g to 1000 m2/g. The following formula was used for the percent change in surface area % change in surface area =?S ???????− S ? !?? "# × 100 S ? !?? " Here, S Control and S Treated is the surface area of control and treated samples, respectively. 2.5. DSC Study 2. Materials and Methods The melting temperature and latent heat of fusion of control and treated protose were determine using the Pyris-6 Perkin Elmer differential scanning calorimeter. The analytes were heated at the rate of 10ºC/min under the air atmosphere with flow rate of 5 mL/min. An empty pan sealed with cover lid was used as the reference pan. The latent heat of fusion (∆H) and the melting temperature (Tm) of both the control and treated samples were obtained from the DSC thermograms. 2.1. Study Design Protose was procured from HiMedia Laboratories, India, and divided into two groups i.e. control and treated. The control sample was kept without treatment while the treated sample was handed over in sealed pack to Mr. Trivedi for the biofield energy treatment. Mr. Trivedi rendered the biofield energy treatment to the treated group via his unique energy transmission process under standard laboratory conditions. Afterward, the treated and control samples were evaluated using several analytical techniques such as X-ray diffractometry (XRD), particle size analysis, surface area analysis, differential scanning thermogravimetric analysis-derivative (TGA/DTG), and Fourier transform infrared (FT-IR) spectroscopy. 2.6. TGA/DTG Analysis The TGA/DTG analysis of both control and treated samples of protose was carried out on Mettler Toledo simultaneous TGA/DTG analyzer. The analytes were heated up to 400ºC from the room temperature, at the heating rate of 5ºC/min, under the air atmosphere. The onset temperature of thermal degradation and temperature at which maximum weight loss occur (Tmax) in samples were obtained from the TGA/DTG thermogram. calorimetry thermogravimetry (DSC), 2.2. XRD Study The XRD study of protose samples (control and treated)
American Journal of Biomedical and Life Sciences 2015; 3(6): 104-110 106 2.7. FT-IR Spectroscopic Characterization treated samples of protose was determined using the laser particle size analyzer, and results are shown in Fig. 2. The particle size result showed the d50 of control and treated samples as 8.36 and 9.42 µm, respectively; and the d99 of control and treated samples as 58.16 and 111.05 µm, respectively. The results showed about 12.68% increase in the d50 and 90.94% increase in the d99 of treated protose as compared to the control protose. The FT-IR spectroscopy of both the control and treated samples of protose was carried out to ascertain the effect of biofield energy treatment on molecular level like dipole moment, force constant, and bond strength in chemical structure [20]. The samples were prepared by crushing the powdered protose sample with spectroscopic grade KBr into fine powder and then pressed into pellets. The FT-IR spectra were acquired from the Shimadzu’s Fourier transform infrared spectrometer (Japan) in the frequency region of 500-4000 cm-1. 3. Results and Discussion 3.1. XRD Analysis The XRD diffractograms of protose samples (control and treated) are shown in Fig. 1. Both the control and treated samples showed the broad halo at 2θ equal to 20.6°. Fig. 2. Particle size of control and treated protose. It is assumed that the biofield energy probably induce the agglomeration process in treated protose sample, which resulted into increases of average particle sizes of treated sample. Recently, our group reported the biofield induced alteration in the particle size of manganese oxide [22]. 3.3. Surface Area Analysis The surface area of control and treated samples of protose was determined using the BET surface area analyzer. The surface area of control and treated samples were found as 1.8137 m2/g and 1.7237 m2/g, respectively. The result showed a decrease in surface area by 4.96% in the treated sample with respect to the control protose (Fig. 3). It is well reported that surface area is inversely proportional to the particle size [23]. Based on this, it is presumed that biofield energy induced the aggregation of protose particle, which leads to increase the particle size of treated sample with respect to the control. This finding is also supported by the particle size analysis, which showed the significant increases in the particle size of treated sample as compared to the control. Based on this, it is depicted that the surface area of treated sample was decreased substantially due to the effect of biofield energy treatment. Fig. 1. XRD diffractograms of control and treated protose. The halo patterns of XRD peaks suggest the amorphous nature of both control and treated samples [21]. The XRD study suggested that biofield energy treatment did not cause any alteration in the physical form of protose with respect to the control sample. 3.2. Particle Size Analysis Fig. 3. Surface area of control and treated protose. The average particle size (d50) and the particle size below which 99% particles are present (d99) in both the control and
107 Mahendra Kumar Trivedi et al.: Physicochemical and Spectroscopic Properties of Biofield Energy Treated Protose 3.4. DSC Analysis change the physical form from solid to gas. Previously, our group has reported that biofield treatment altered the latent heat of fusion of tin and lead metal powders [8]. Therefore, it is expected that biofield treatment might alter the intermolecular interaction of treated protose that may lead to increase in latent heat of fusion. DSC analysis was carried out to determine the latent heat of fusion (∆H) and melting temperature of protose samples (control and treated). DSC thermograms of control and treated samples are presented in Fig. 4. The melting temperatures of control and treated protose were observed as 204.62°C and 197.68°C. 3.5. TGA/DTG Analysis The TGA/DTG thermogram of control and treated protose samples are shown in Fig. 5, and data are presented in Table 1. The TGA thermogram of control sample showed three steps of thermal degradation. First step was started from 50°C (onset) and ended at 100°C (endset). The second step of thermal degradation was started from 189°C, which was continued up to 235°C, and the third step was started from 256°C and ended at 357°C. During these three steps of thermal degradation, the weight loss observed was observed as 16.26%, 6.52%, and 23.13%, respectively. On the other hand, the treated sample showed two steps of thermal degradation. First step was started from 195°C and continued until 245°C while the second step was started from 269°C that was continued up to 380°C. During the thermal degradation process in these two steps, the treated sample showed 8.34 and 26.40% weight loss. The result showed the maximum weight loss during thermal degradation in the third (in control) and second (in treated sample) step. Therefore, these two steps were compared for the thermal study of both the control and treated samples. The result showed about 5.47% decrease in the onset temperature of thermal degradation of treated sample with respect to the control protose. Moreover, the maximum thermal degradation temperature (Tmax)was observed as 302.48°C and 317.65°C in control and treated samples, respectively. This showed about 5.66% increase in the Tmax as compared the control. The increase in Tmax of treated sample might be due to the alteration in internal energy through biofield energy treatment, which results into enhanced thermal stability of treated sample as compared to the control [25]. Based on this it is depicted that the biofield treated protose is more thermally stable than the control sample. Fig. 4. DSC thermograms of control and treated protose. The result showed the slight decrease in the melting temperature of treated sample as compared to the control sample (Table 1). Further, the latent heat of fusion corresponding to the control and treated protose samples was observed as 62.44 J/g and 76.48 J/g, respectively (Table 1). 3.6. FT-IR Spectroscopic Analysis The FT-IR spectra of the control and treated protose are shown in Fig. 6. The protose is composed with combinations of proteoses, peptones, amino acids etc. [6]. Due to presence of these different components, it contain several functional groups such as amide (N-H, C=O), aromatic ring (C-H, C=C) etc. The FT-IR spectrum of control sample showed the vibrational peak at 3224 cm-1 that was attributed to O-H or N-H stretching due to presence of amino acids. This peak was appeared at the upstream frequency region i.e. at 3261 cm-1 in the treated sample. The stretching frequency of any bond is directly proportional to the force constant and inversely proportional to reduced mass [26, 27]. Therefore, it is presumed that biofield energy treatment might increase the dipole moment of N-H or O-H bond in treated protose molecules as compared to Table 1. Thermal analysis of control and treated samples of protose. Parameter Latent heat of fusion (J/g) Melting point (ºC) Onset temperature (ºC) End-set temperature (ºC) Tmax (ºC) Control 62.44 204.62 273.83 348.27 302.48 Treated 76.48 197.68 258.85 362.22 317.65 Tmax: temperature at which maximum weight loss occurs This showed about 22.49% increase in the latent heat of fusion of treated protose with respect to the control. It may be due to increase in intermolecular force [24] in treated protose sample as compared to the control protose. As a result, the treated protose sample probably required more energy in the form of latent heat of fusion as compared to the control to
American Journal of Biomedical and Life Sciences 2015; 3(6): 104-110 108 the control. As a result, the force constant and bond strength of N-H or O-H group might increase in the treated protose as compared to the control. Further the vibration peak at 3066 cm-1 in the control sample was attributed to the =C-H (aromatic) bond. This peak was observed at the similar frequency region of 3064 cm-1 in the treated sample. The vibrational peak at 2974 cm-1 was assigned to the =C-H (aliphatic) peak that was observed at the slightly upstream region i.e. at 2981 cm-1. The IR peaks at 2883 and 1402 cm-1 in the control sample were assigned to the C-H (CH3) stretching and bending, respectively. These peaks were correspondingly observed at the similar frequency region i.e. at 2881 and 1402 cm-1 in the treated sample [28]. The IR peaks appeared at 1654 and 1541 cm-1 in the control and treated samples were assigned to the amide C=O (probably due to presence of amino acids) and C=C (aromatic ring) stretchings [29]. The IR peak at 1334 cm-1 in control sample was assigned to S=O asymmetric stretching, this was appeared at 1336 cm-1 in the treated sample of protose. The vibrational peaks at 1245 and 1080 cm-1 in the control as well as in the treated sample were attributed to the C-C and C-N stretchings, respectively [28]. Furthermore, the peak at 547 cm-1 in the control sample was assigned to the out of plane ring deformation of aromatic ring, which was shifted to the lower frequency region of 540 cm-1 in the treated sample. This showed the increase in the flexibility of aromatic ring in the treated sample as compared to the control. Overall, the FT-IR study suggested the significant impact of biofield energy treatment on bond strength and force constant of some functional groups like C=O, C-H, N-H, O-H etc. Fig. 5. TGA/DTG thermograms of control and treated protose.
109 Mahendra Kumar Trivedi et al.: Physicochemical and Spectroscopic Properties of Biofield Energy Treated Protose Fig. 6. FT-IR spectra of control and treated protose. study showed the slight increase in Tmax by 5.66% as compared to the control. This showed the increase in thermal stability of treated protose as compared to the corresponding control sample. Moreover, the FT-IR study revealed the increase in wavenumber of O-H, N-H, S=O, and C-H (methyl) stretching after biofield treatment with respect to the control sample. Overall, the present study concluded the considerable impact of Mr. Trivedi’s biofield energy treatment on physical, thermal and spectroscopic properties of protose. Based on this, it is anticipated that Mr. Trivedi’s biofield energy treatment can modify the physicochemical properties of protose so that it 4. Conclusion In conclusion, the XRD study showed the amorphous nature of protose in both the samples (control and treated). The particle size analysis suggested the significant increase in the particle size i.e. d50 and d99 of the treated protose with respect to the control. This was also supported by the corresponding decrease in the surface area of treated sample as compared to the control. The DSC study revealed the significant increase in the latent heat of fusion by 22.49% in treated protose with respect to the control. The TGA/DTG
American Journal of Biomedical and Life Sciences 2015; 3(6): 104-110 110 [13]Warber SL, Cornelio D, Straughn J, Kile G (2004) Biofield energy healing from the inside. J Altern Complement Med 10: 1107-1113. could be utilized as a better culture medium for the production of enzymes, antibiotics, and veterinary preparations. Abbreviations [14]Chang PL (2015) What is the human biofield and the role of biophotons? http://energyfanatics.com/2015/01/02/what-is-human-biofield- role-biophotons. NIH: National Institute of Health; NCCAM: National Center for Complementary and Alternative Medicine; XRD: X-ray diffraction; DTG: Derivative Thermogravimetry; TGA: Thermogravimetric Analysis [15]Stenger VJ (1999) Bioenergetic fields. Sci Rev Alternative Med 3. http://www.colorado.edu/philosophy/vstenger/Medicine/Biofield. html Acknowledgments [16]Shinde V, Sances F, Patil S, Spence A (2012) Impact of biofield treatment on growth and yield of lettuce and tomato. Aust J Basic Appl Sci 6: 100-105. The authors would like to thank the Trivedi Testimonials, Trivedi Science, and Trivedi Master Wellness for their support during the study. Authors would also like to acknowledge the whole scientific team of MGV pharmacy college, Nashik for allowing the instrumental facility. [17]Sances F, Flora E, Patil S, Spence A, Shinde V (2013) Impact of biofield treatment on ginseng and organic blueberry yield. Agrivita, J Agric Sci 35. [18]Nayak G, Altekar N (2015) Effect of biofield treatment on plant growth and adaptation. J Environ Health Sci 1: 1-9. References [19]Trivedi MK, Nayak G, Patil S, Tallapragada RM, Jana S, et al. (2015) Bio-field treatment: An effective strategy to improve the quality of beef extract and meat infusion powder. J Nutr Food Sci 5: 389. [1]Urry LA (2013) e-Study guide for campbell biology in focus. (1stedn), Cram 101 textbook reviews. eISBN 9781478445562. [2]Park B, Lu R (2015) Hyperspectral imaging technology in food and agriculture. Springer technology & engineering. Media LLC, New York. [20]Pavia DL, Lampman GM, Kriz GS (2001) Introduction to spectroscopy. (3rdedn), Thomson Learning, Singapore. [21]Chauhan A, Chauhan P (2014) Powder XRD technique and its applications in science and technology. J Anal Bioanal Tech 5: 212. [3]http://2.imimg.com/data2/TS/YC/MY-1034079/animal-origin- peptones-protein-hydrolysates.pdf [4]Pasupuleti VK, Braun S (2010) Protein Hydrolysates in Biotechnology. State of the Art Manufacturing of Protein Hydrolysates. Springer Science & Business Media. New York. [22]Trivedi MK, Nayak G, Patil S, Tallapragada RM, Latiyal O (2015) Evaluation of biofield treatment on physical, atomic and structural characteristics of manganese (II, III) oxide. J Material Sci Eng 4: 177. [5]http://www.neogen.com/Acumedia/pdf/MediaIngredients.pdf [23]Groza JR, Shackelford JF (2007) Materials processing handbook. Taylor and Francis group, CRC Press. [6]http://himedialabs.com/TD/RM280.pdf [7]Lenssen AW (2013) Biofield and fungicide seed treatment influences on soybean productivity, seed quality and weed community. Agricultural Journal 8: 138-143. [24]Cairo JM (2013) Mosby's respiratory care equipment. (9thedn), Elsevier health sciences, St. Louis Missouri. [25]Spear RJ, Maksacheff M (1986) The relationship between ignition temperature and thermal stability for selected primary explosives. Thermochim Acta 105: 287-293. [8]Trivedi MK, Patil S, Tallapragada RM (2013) Effect of bio field treatment on the physical and thermal characteristics of silicon, tin and lead powders. J Material Sci Eng 2: 125. [26]Smith BC (1998) Infrared spectral interpretation: A systematic approach. CRC Press. [9]Koithan M (2009) Introducing complementary and alternative therapies. J Nurse Pract 5: 18-20. [27]Chaban GM, Huo WM, Lee TJ (2002) Theoretical study of infrared and Raman spectra of hydrated magnesium sulfate salts. The J Chem Phys 117: 2532-2537. [10]Rubik B (2008) Measurement of the human biofield and other energetic instruments, Chapter 20 of energetics and spirituality by Lyn Freeman. http://www.faim.org/energymedicine/measurement-human-bio field.html. [28]http://www.instruction.greenriver.edu/kmarr/chem%20162/Ch em162%20Labs/Interpreting%20IR%20Spectra/IR%20Absor ptions%20for%20Functional%20Groups.htm [11]Ho MW (1995) Bioenergetics and the coherence of organisms. Neuronetwork World 5: 733-750. [29]Lin-Vien D, Colthup NB, Fateley WG, Grasselli JG (1991) The handbook of infrared and Raman characteristic frequencies of organic molecules. Academic press, San Diego, New York. [12]Gough WC (1999) The cellular communication process and alternative modes of healing. Subtle Energies Energy Med 8: 67-101.