Download
1 / 57
580 likes | 697 Views
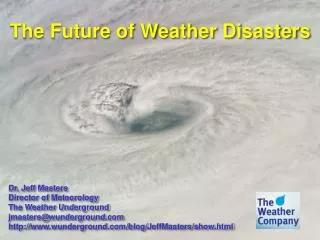
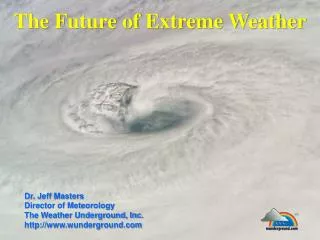
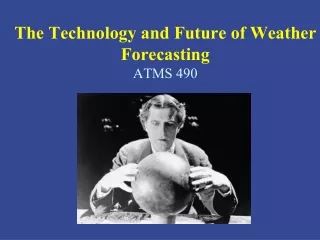
The Future of Weather Disasters. Dr. Jeff Masters Director of Meteorology The Weather Underground, LLC jmasters@ wunderground.com http:// www.wunderground.com / blog/ JeffMasters / show.html. Served as Flight Meteorologist for NOAA ’ s Aircraft Operations Center, 1986 - 1990.

E N D
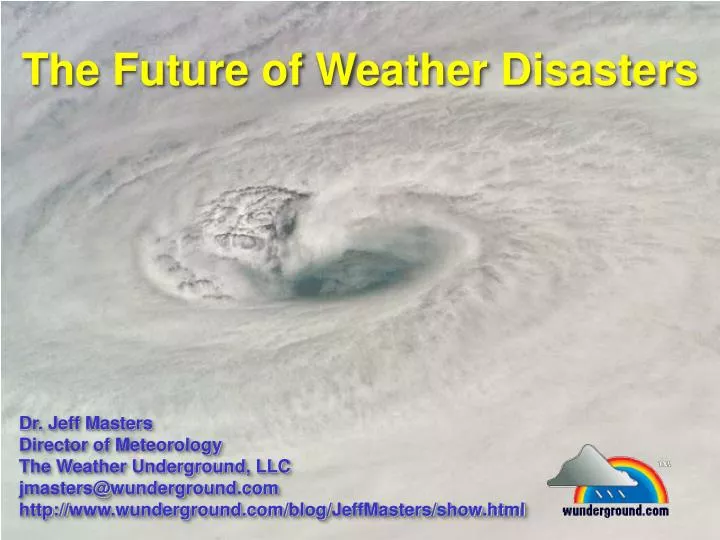
The Future of Weather Disasters Dr. Jeff Masters Director of Meteorology The Weather Underground, LLC jmasters@wunderground.com http://www.wunderground.com/blog/JeffMasters/show.html
Served as Flight Meteorologist for NOAA’s Aircraft Operations Center, 1986 - 1990 Publications: • Correction of Inertial Navigation with Loran-C on NOAA's P-3 Aircraft • A Record Minimum Sea Level Pressure Observed in Hurricane Gilbert • Wind Measurement From Aircraft
The story of my flight through Hurricane Hugo: http://www.wunderground.com/resources/education/hugo1.asp
The comments section of Jeff Masters’ Wunderblog: Not for the faint of heart! Beware of trolls and nastiness, but also expect great links, commentary, news, and inspiration.
Major Inspiration: the Birth of the Portlight Disaster Relief Charity, Comments Section of my September 13, 2008 Post, “Ike Makes a Direct Hit On Galveston”
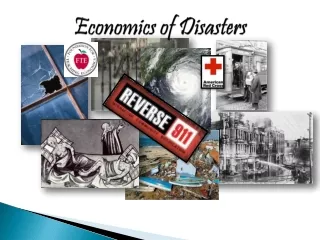
Most Expensive U.S. Weather Disasters Since 1980 Source: http://www.ncdc.noaa.gov/billions * Preliminary estimate, not from NCDC
$15+ Billion non-U.S. Weather Disasters Since 1980 Source: http://www.emdat.be
Extremes Have been Rising Since the 1970s, and the Two Most Extreme Years in U.S. History Were Also the Two Warmest Years: 2012 and 1998
Since 2006, Dangerously Hot 1-in-741 Year Summers Have Expanded by 50 Times Compared to 1951 - 1980 Percent area covered by summer temperature anomalies in categories defined as hot (> 0.43 standard deviations, 33% chance), very hot (> 2 standard deviations, 2.3% chance), and extremely hot (> 3 standard deviations, .13% chance.) Anomalies and standard deviation computed from a 1951 - 1980 climatology. Extremely hot 3-standard deviation summers covered 0.1-0.2% of Earth’s surface in 1951-1980, but now cover 4-13%. From Hansen et al., 2012, "Perception of Climate Change.”
There is More Moisture in the Air, and the Heavy Precipitation Events Most Likely to Cause Flooding are Increasing
Extreme Summer Jet Stream Patterns Have Doubled in Frequency in the Past 11 Years
Are Tornadoes Increasing in Frequency and Intensity? 2007 United Nations IPCC report: "There is insufficient evidence to determine whether trends exist in small scale phenomena such as tornadoes, hail, lighting, and dust storms."
However, Bouwer (BAMS, 2010) reviewed 22 disaster loss studies world-wide, published 2001 - 2010; in all 22 studies, increases in wealth and population were the "most important drivers for growing disaster losses." Conclusion: human-caused climate change "so far has not had a significant impact on losses from natural disasters."
The Tornado Database is Highly Unsuitable for Detecting Long-Term Trends, but Shows no Change in EF-1 and Stronger Tornadoes
Severe Thunderstorms are Predicted to Increase Trapp et al., 2007
Are Hurricanes Getting Stronger? “It remains uncertain whether past changes in any tropical cyclone activity (frequency, intensity, rainfall, and so on) exceed the variability expected through natural causes” - 2010 Review Article by Ten Top Hurricane Scientists, “Tropical cyclones and climate change” Hurricane Igor of 2010 as seen from the International Space Station
But, 1-in-20 Year “Katrina-level” Storm Surges are Increasing, and are Twice as Likely in Warm Years Grinsted et al. 2012, "A homogeneous record of Atlantic hurricane surge threat since 1923."
Expect a 5% increase in hurricane winds per °C of ocean warming (Emanuel, 2005). • Expected increase in SST by 2100: 1-2 °C. • Hurricane wind speeds should increase by 5-10%. • Difference in wind speed between a Cat 3 and Cat 4: 15%. • Thus, major hurricanes in 2100 should do 1.5 - 3 times more damage than they do now.
Twelve Potential $100 Billion Weather-Related Disasters of the Next 30 Years Dr. Jeff Masters Director of Meteorology The Weather Underground, LLC http://www.wunderground.com
12) Tampa Bay Hurricane Probability: 20% Bayshore Drive, Tampa FL, after the 1921 Hurricane
11) Japanese Super Typhoon Probability: 10% Flooding from Category 5 Super Typhoon Vera, September 26, 1959 Strongest typhoon on record in Japan: 160 mph winds, 5,098 killed
10) China Flood Probability: 20% China floods and landslides, 2010: 4245 killed, $51 billion damage
9) Galveston/Houston Hurricane Probability: 30% 1900 Galveston Hurricane damage
8) Miami Hurricane Probability: 40% Miami Beach, 1926 Hurricane
7) New Orleans Hurricane Probability: 30% New Orleans after Hurricane Katrina, 2005
6) China Drought Probability: 20% Northern China dust storm, April 6, 2001
5) New York City Hurricane Probability: 10% Hurricane Sandy approaching New Jersey, October 28, 2012
South Ferry station after Hurricane Sandy; damage: $600 million
Casino Pier in Seaside Heights, N.J. on Oct. 30, 2012, after Hurricane Sandy.
New York's LaGuardia Airport after the November 25, 1950 Nor'easter
4) California ARkSTORM Flood Probability: 20% June 4, 2004 levee breach in the Sacramento-San Joaquin River Delta
3) U.S. Drought Probability: 50% Midwest U.S. drought, 2012: $35 billion in damage
Dust Bowl Drought: 5,000 killed, 2.5 million people displaced