Download
1 / 1
10 likes | 103 Views
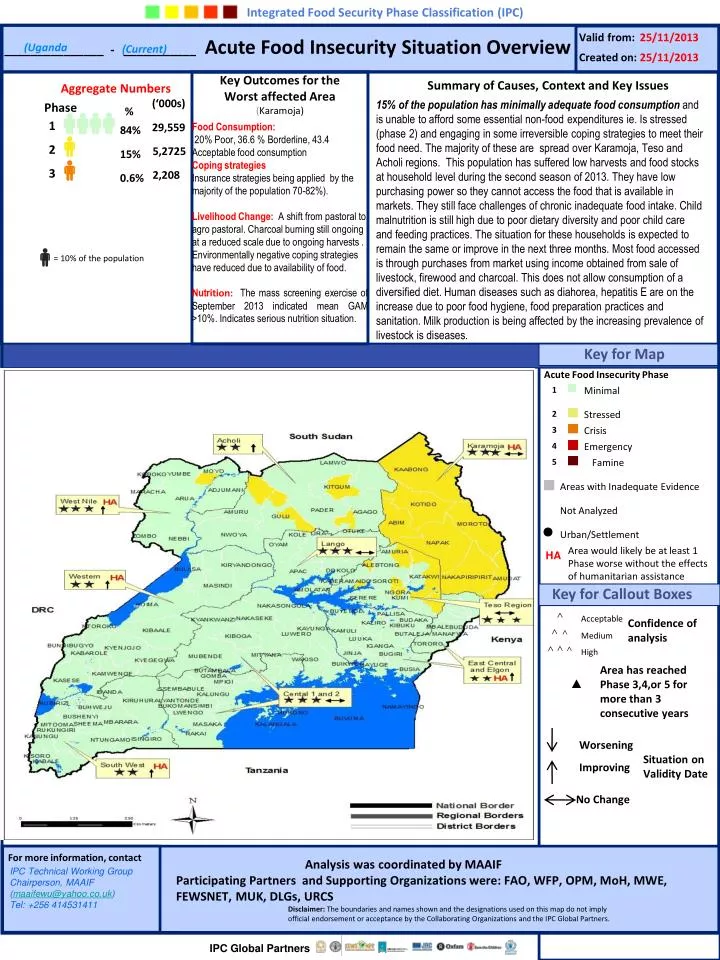
%. 29,559. 84%. 5,2725. 15%. 2,208. 0.6%. = 10% of the population. ^. Acceptable. Confidence of analysis. ^. ^. Medium. ^. ^. ^. High. Integrated Food Security Phase Classification (IPC). Valid from:. 25/11/2013. Acute Food Insecurity Situation Overview. (Uganda.

E N D
% 29,559 84% 5,2725 15% 2,208 0.6% = 10% of the population ^ Acceptable Confidence of analysis ^ ^ Medium ^ ^ ^ High Integrated Food Security Phase Classification (IPC) Valid from: 25/11/2013 Acute Food Insecurity Situation Overview (Uganda _______________ - ___________ (Current) Created on: 25/11/2013 Key Outcomes for the Worst affected Area Summary of Causes, Context and Key Issues Aggregate Numbers (‘000s) 15% of the population has minimally adequate food consumption and is unable to afford some essential non-food expenditures ie. Is stressed (phase 2) and engaging in some irreversible coping strategies to meet their food need.The majority of these are spread over Karamoja, Teso and Acholi regions. This population has suffered low harvests and food stocks at household level during the second season of 2013. They have low purchasing power so they cannot access the food that is available in markets. They still face challenges of chronic inadequate food intake. Child malnutrition is still high due to poor dietary diversity and poor child care and feeding practices. The situation for these households is expected to remain the same or improve in the next three months. Most food accessed is through purchases from market using income obtained from sale of livestock, firewood and charcoal. This does not allow consumption of a diversified diet. Human diseases such as diahorea, hepatitis E are on the increase due to poor food hygiene, food preparation practices and sanitation. Milk production is being affected by the increasing prevalence of livestock is diseases. Phase (Karamoja) 1 Food Consumption: 20% Poor, 36.6 % Borderline, 43.4 Acceptable food consumption Coping strategies Insurance strategies being applied by the majority of the population 70-82%). Livelihood Change:A shift from pastoral to agro pastoral. Charcoal burning still ongoing at a reduced scale due to ongoing harvests . Environmentally negative coping strategies have reduced due to availability of food. Nutrition: The mass screening exercise of September 2013 indicated mean GAM >10%. Indicates serious nutrition situation. 2 3 Key for Map Acute Food Insecurity Phase 1 Minimal 2 Stressed 3 Crisis 4 Emergency 5 Famine Areas with Inadequate Evidence Not Analyzed Urban/Settlement HA Area would likely be at least 1 Phase worse without the effects of humanitarian assistance Key for Callout Boxes Area has reached Phase 3,4,or 5 for more than 3 consecutive years Worsening Situation on Validity Date Improving No Change For more information, contact Analysis was coordinated by MAAIF Participating Partners and Supporting Organizations were: FAO, WFP, OPM, MoH, MWE, FEWSNET, MUK, DLGs, URCS IPC Technical Working Group Chairperson, MAAIF (maaifewu@yahoo.co.uk) Tel: +256 414531411 Disclaimer: The boundaries and names shown and the designations used on this map do not imply official endorsement or acceptance by the Collaborating Organizations and the IPC Global Partners. IPC Global Partners